begin quote from:
Covid map: Coronavirus cases, deaths, vaccinations by country
By The Visual and Data Journalism Team
BBC News

Covid-19 is continuing to spread around the world, with more than 115 million confirmed cases and 2.5 million deaths across nearly 200 countries.
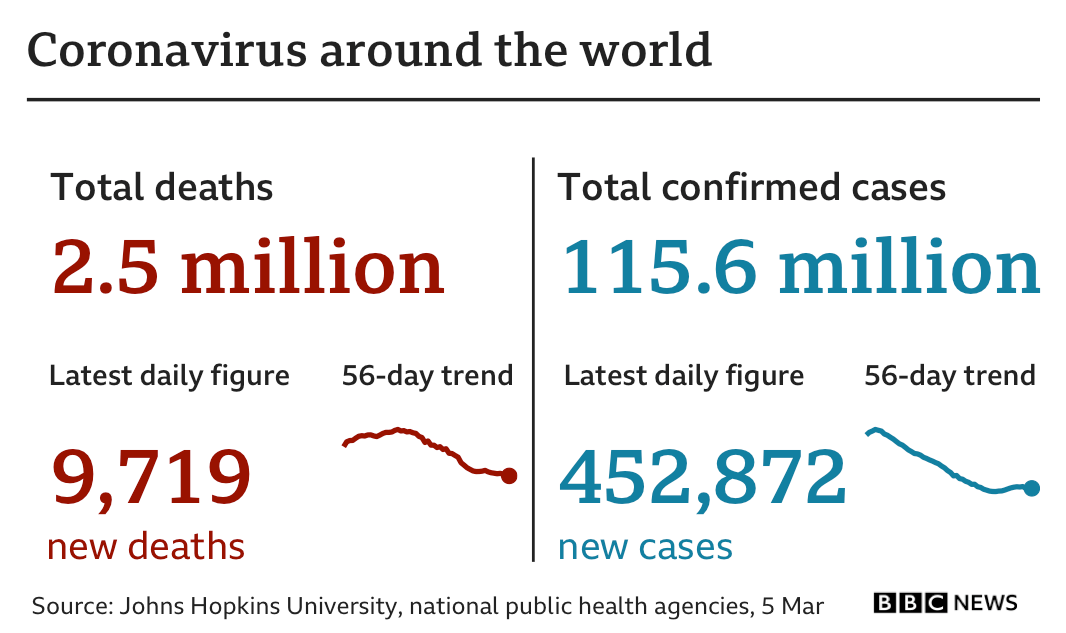

The US, India and Brazil have seen the highest number of confirmed cases, followed by Russia, the UK and a number of European countries.
Very few places have been left untouched.
mapped
 mapped
Source: Johns Hopkins University, national public health agencies
Figures last updated 5 March 2021, 11:38 GMT

In the table below, countries can be reordered by deaths, death rate and total cases. In the coloured bars on the right-hand side, countries in which cases have risen to more than 10,000 per day are those with black bars on the relevant date.
data in detail
*Deaths per 100,000 people
This information is regularly updated but may not reflect the latest totals for each country.
** The past data for new cases is a three day rolling average. Due to revisions in the number of cases, an average cannot be calculated for this date.
Source: Johns Hopkins University, national public health agencies and UN population data
Figures last updated: 5 March 2021, 11:38 GMT
Note: The map, table and animated bar chart in this page use a different source for figures for France and the UK from that used by Johns Hopkins University, which results in a slightly lower overall total. US figures do not include Puerto Rico, Guam or the US Virgin Islands.
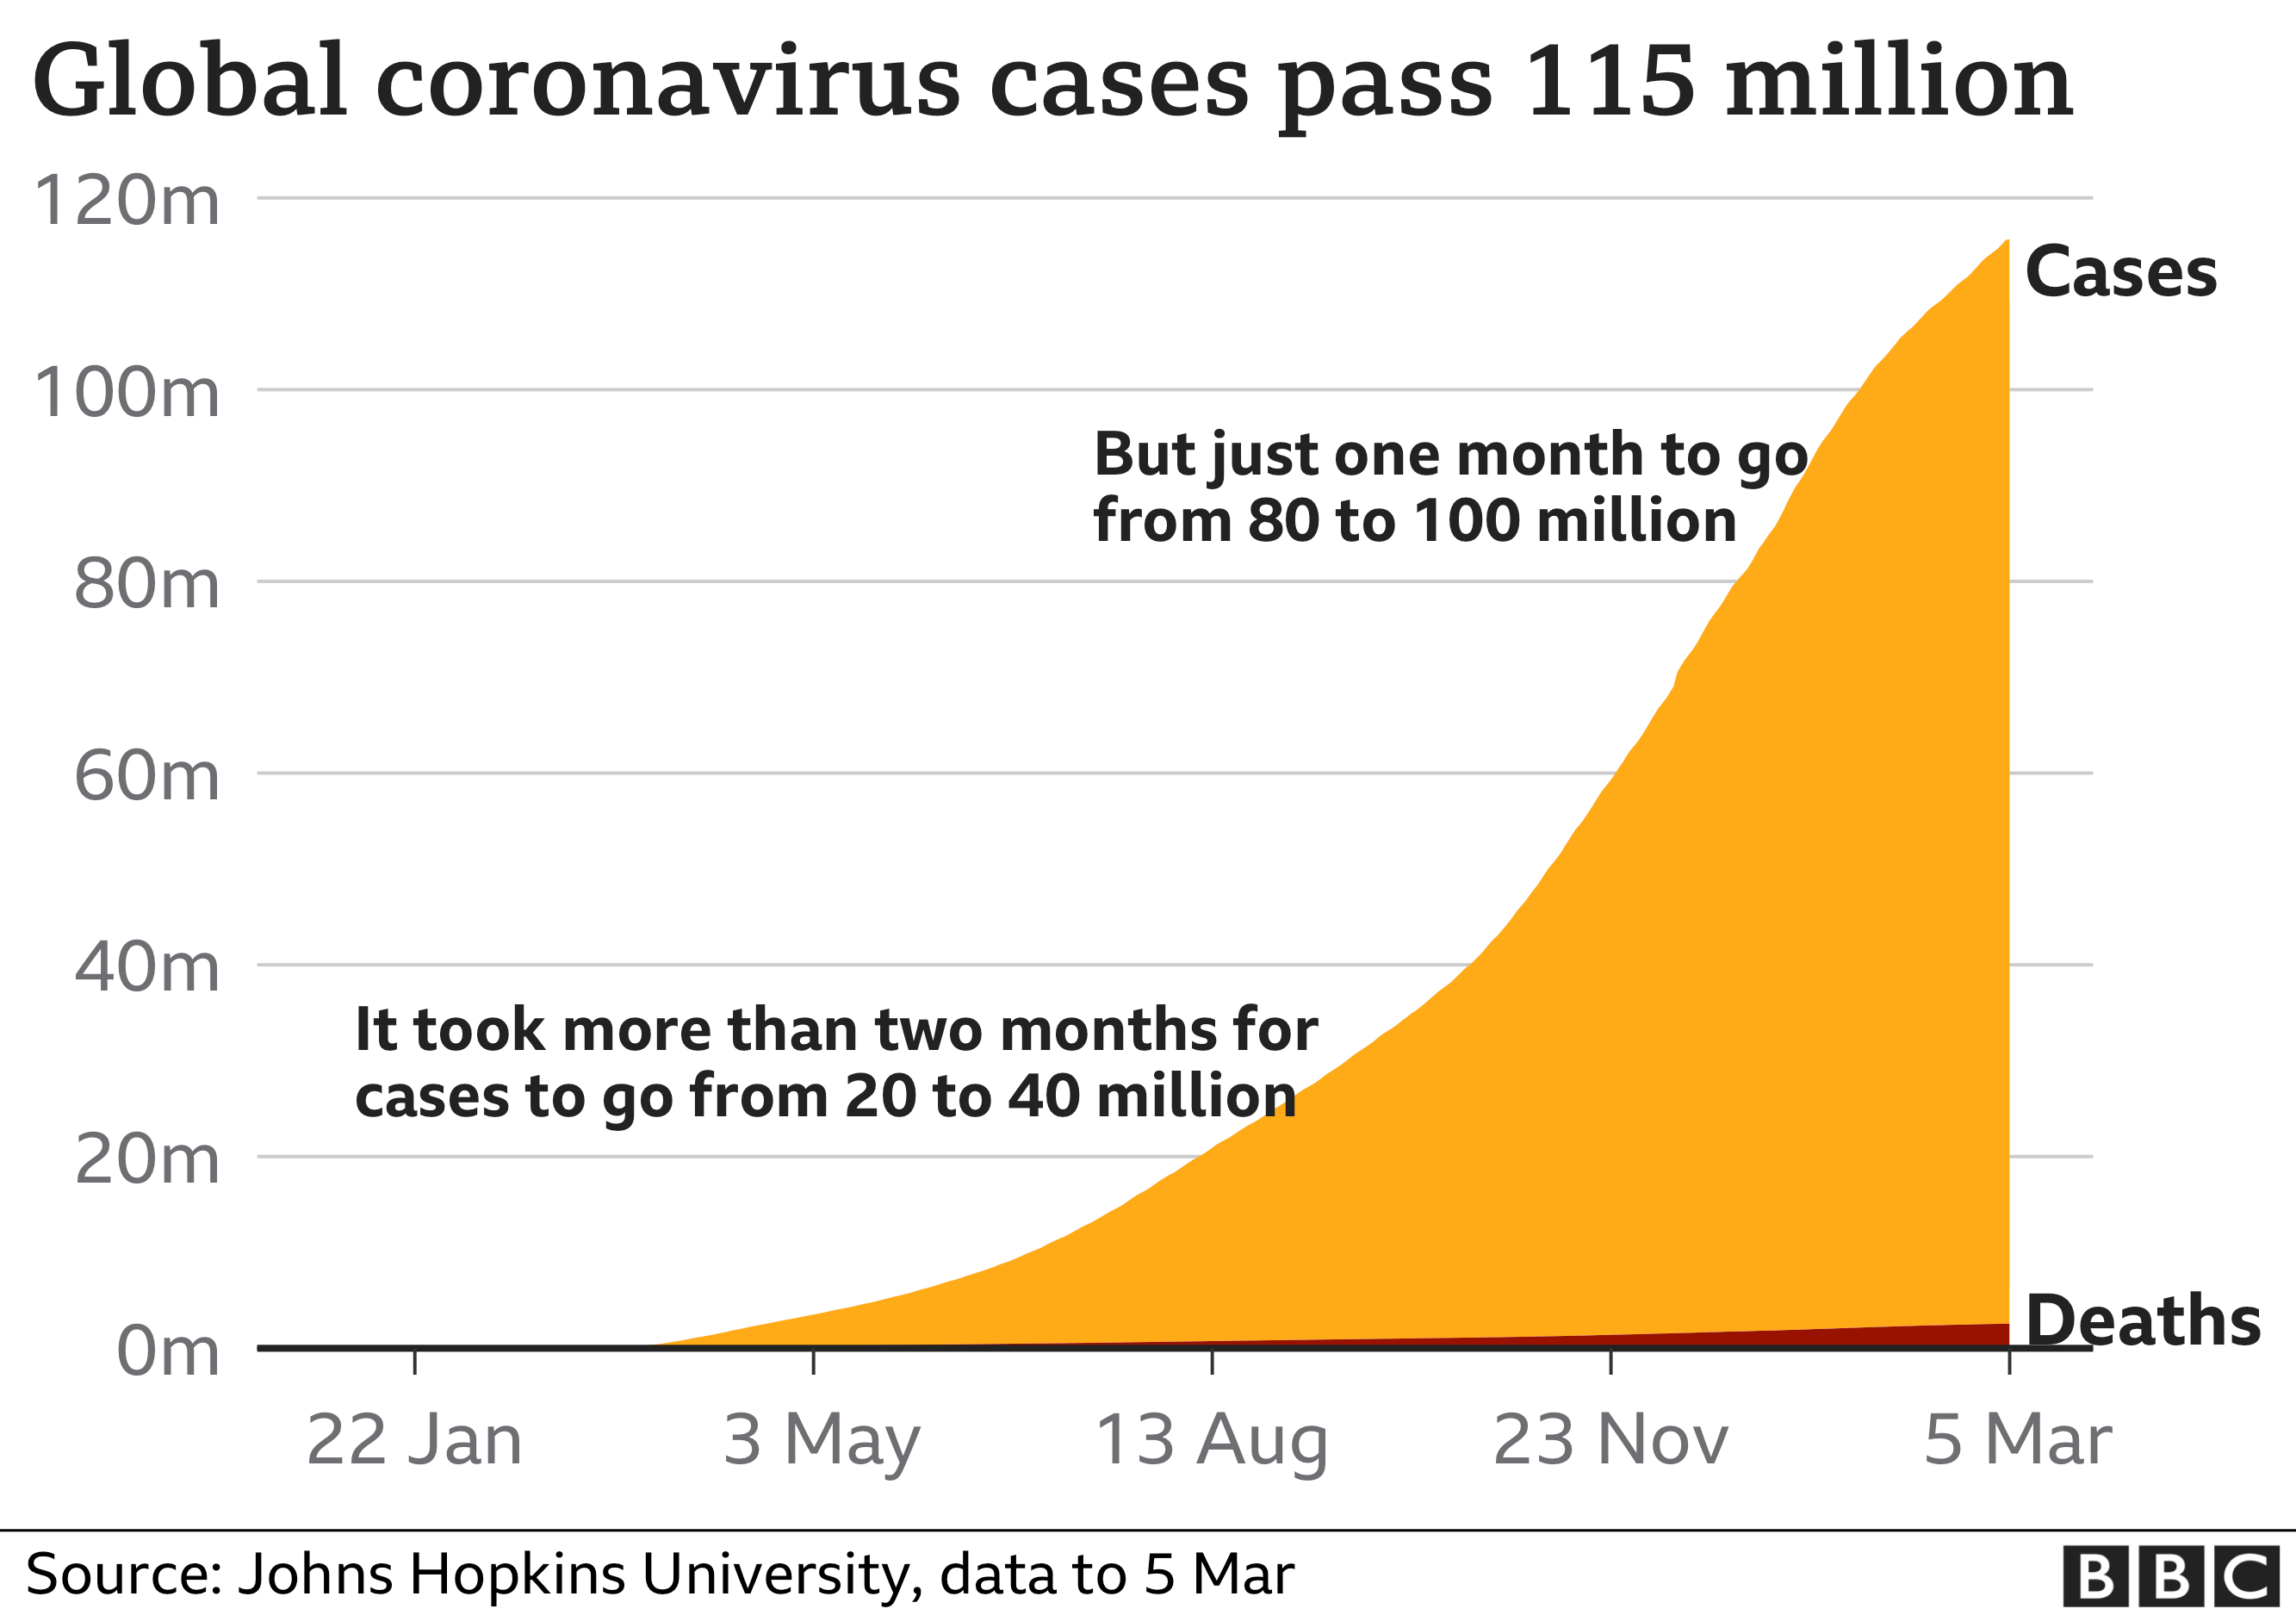
Confirmed cases have been rising steeply since the middle of last year, but the true extent of the first outbreaks in 2020 is unclear because testing was not then widely available.
The 100 millionth coronavirus case was recorded at the end of January - about a year after the first officially diagnosed case of the virus.
Deaths have also been rising, however official figures may not fully reflect the true number in many countries.
Data on excess deaths, a measure of how many more people are dying than would be expected based on the previous few years, may give a better indication of the actual numbers in many cases.
Who has vaccinated the most?
Several coronavirus vaccines against the virus have now been approved for use, either by individual countries or groups of countries, such as the European Union and the World Health Organization (WHO).
Of the 110 countries and territories administering vaccines and publishing rollout data, 62 are high-income nations, 48 are middle-income and none are low-income.
The map below, using figures collated by Our World in Data - a collaboration between Oxford University and an educational charity - shows the total number of doses given per 100 people, mostly first doses.
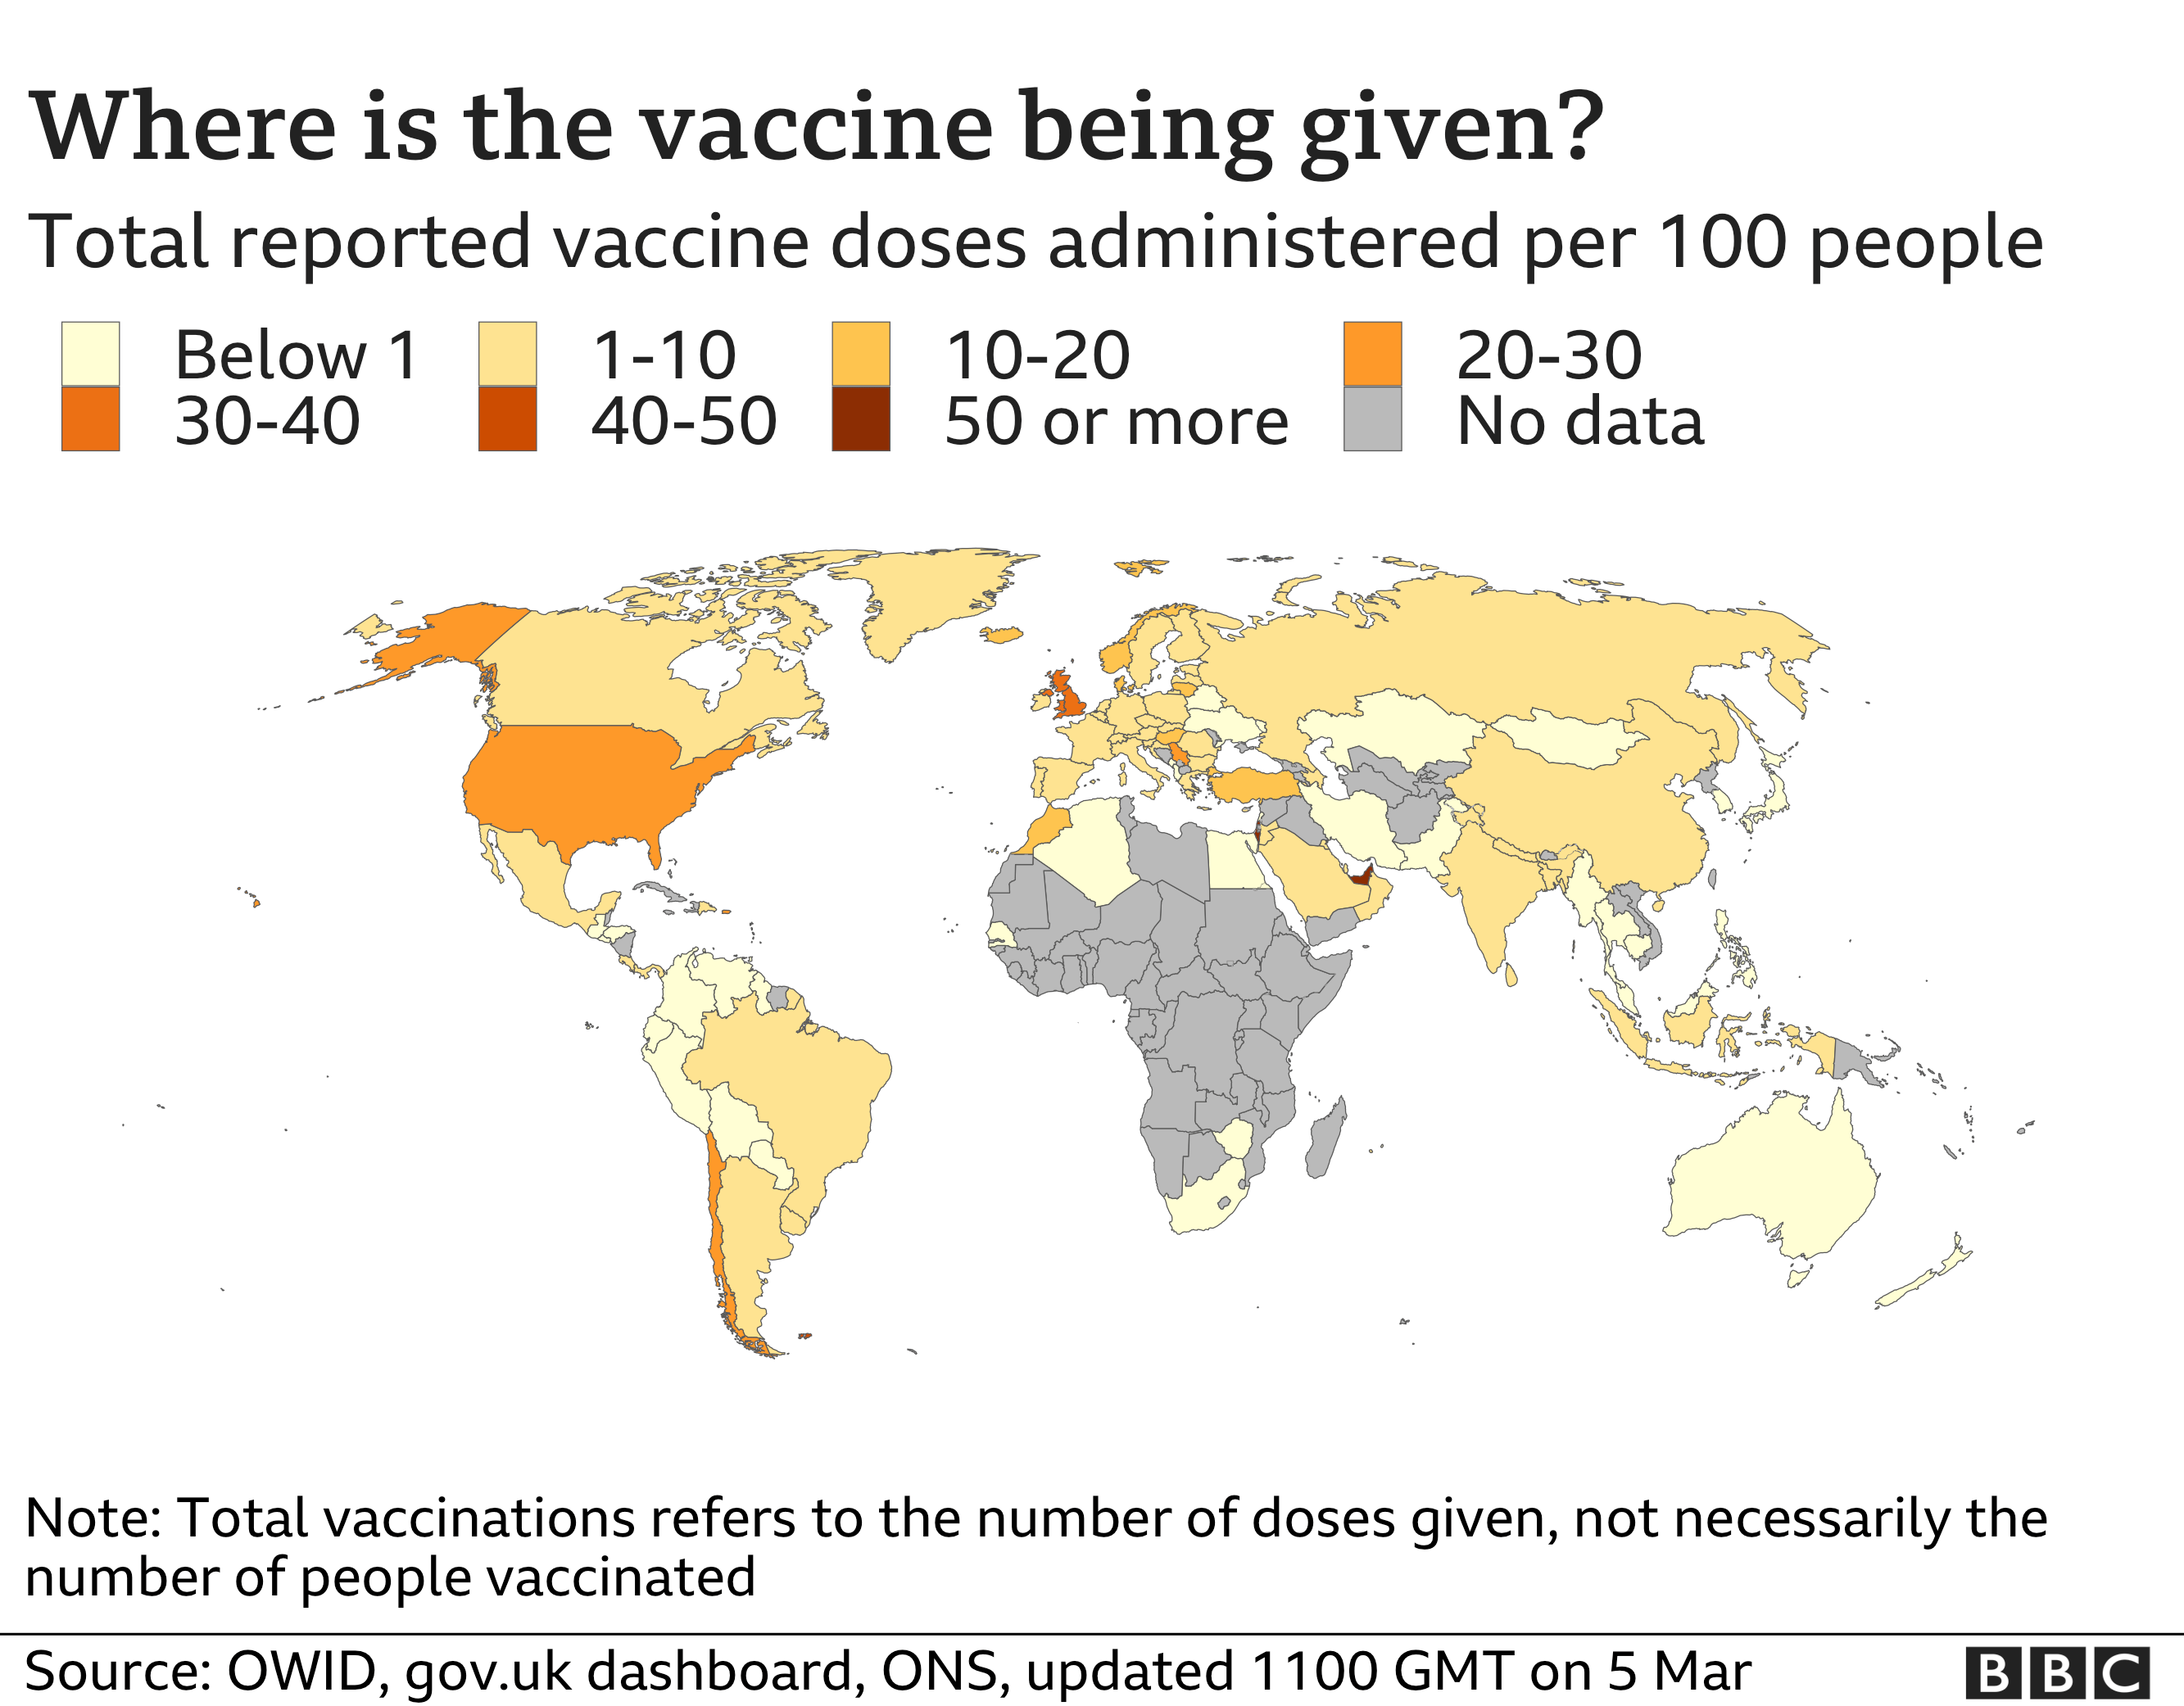
Overall, the US and China have given the most doses, 82 million and 52 million respectively, while the UK has administered almost 22 million so far.
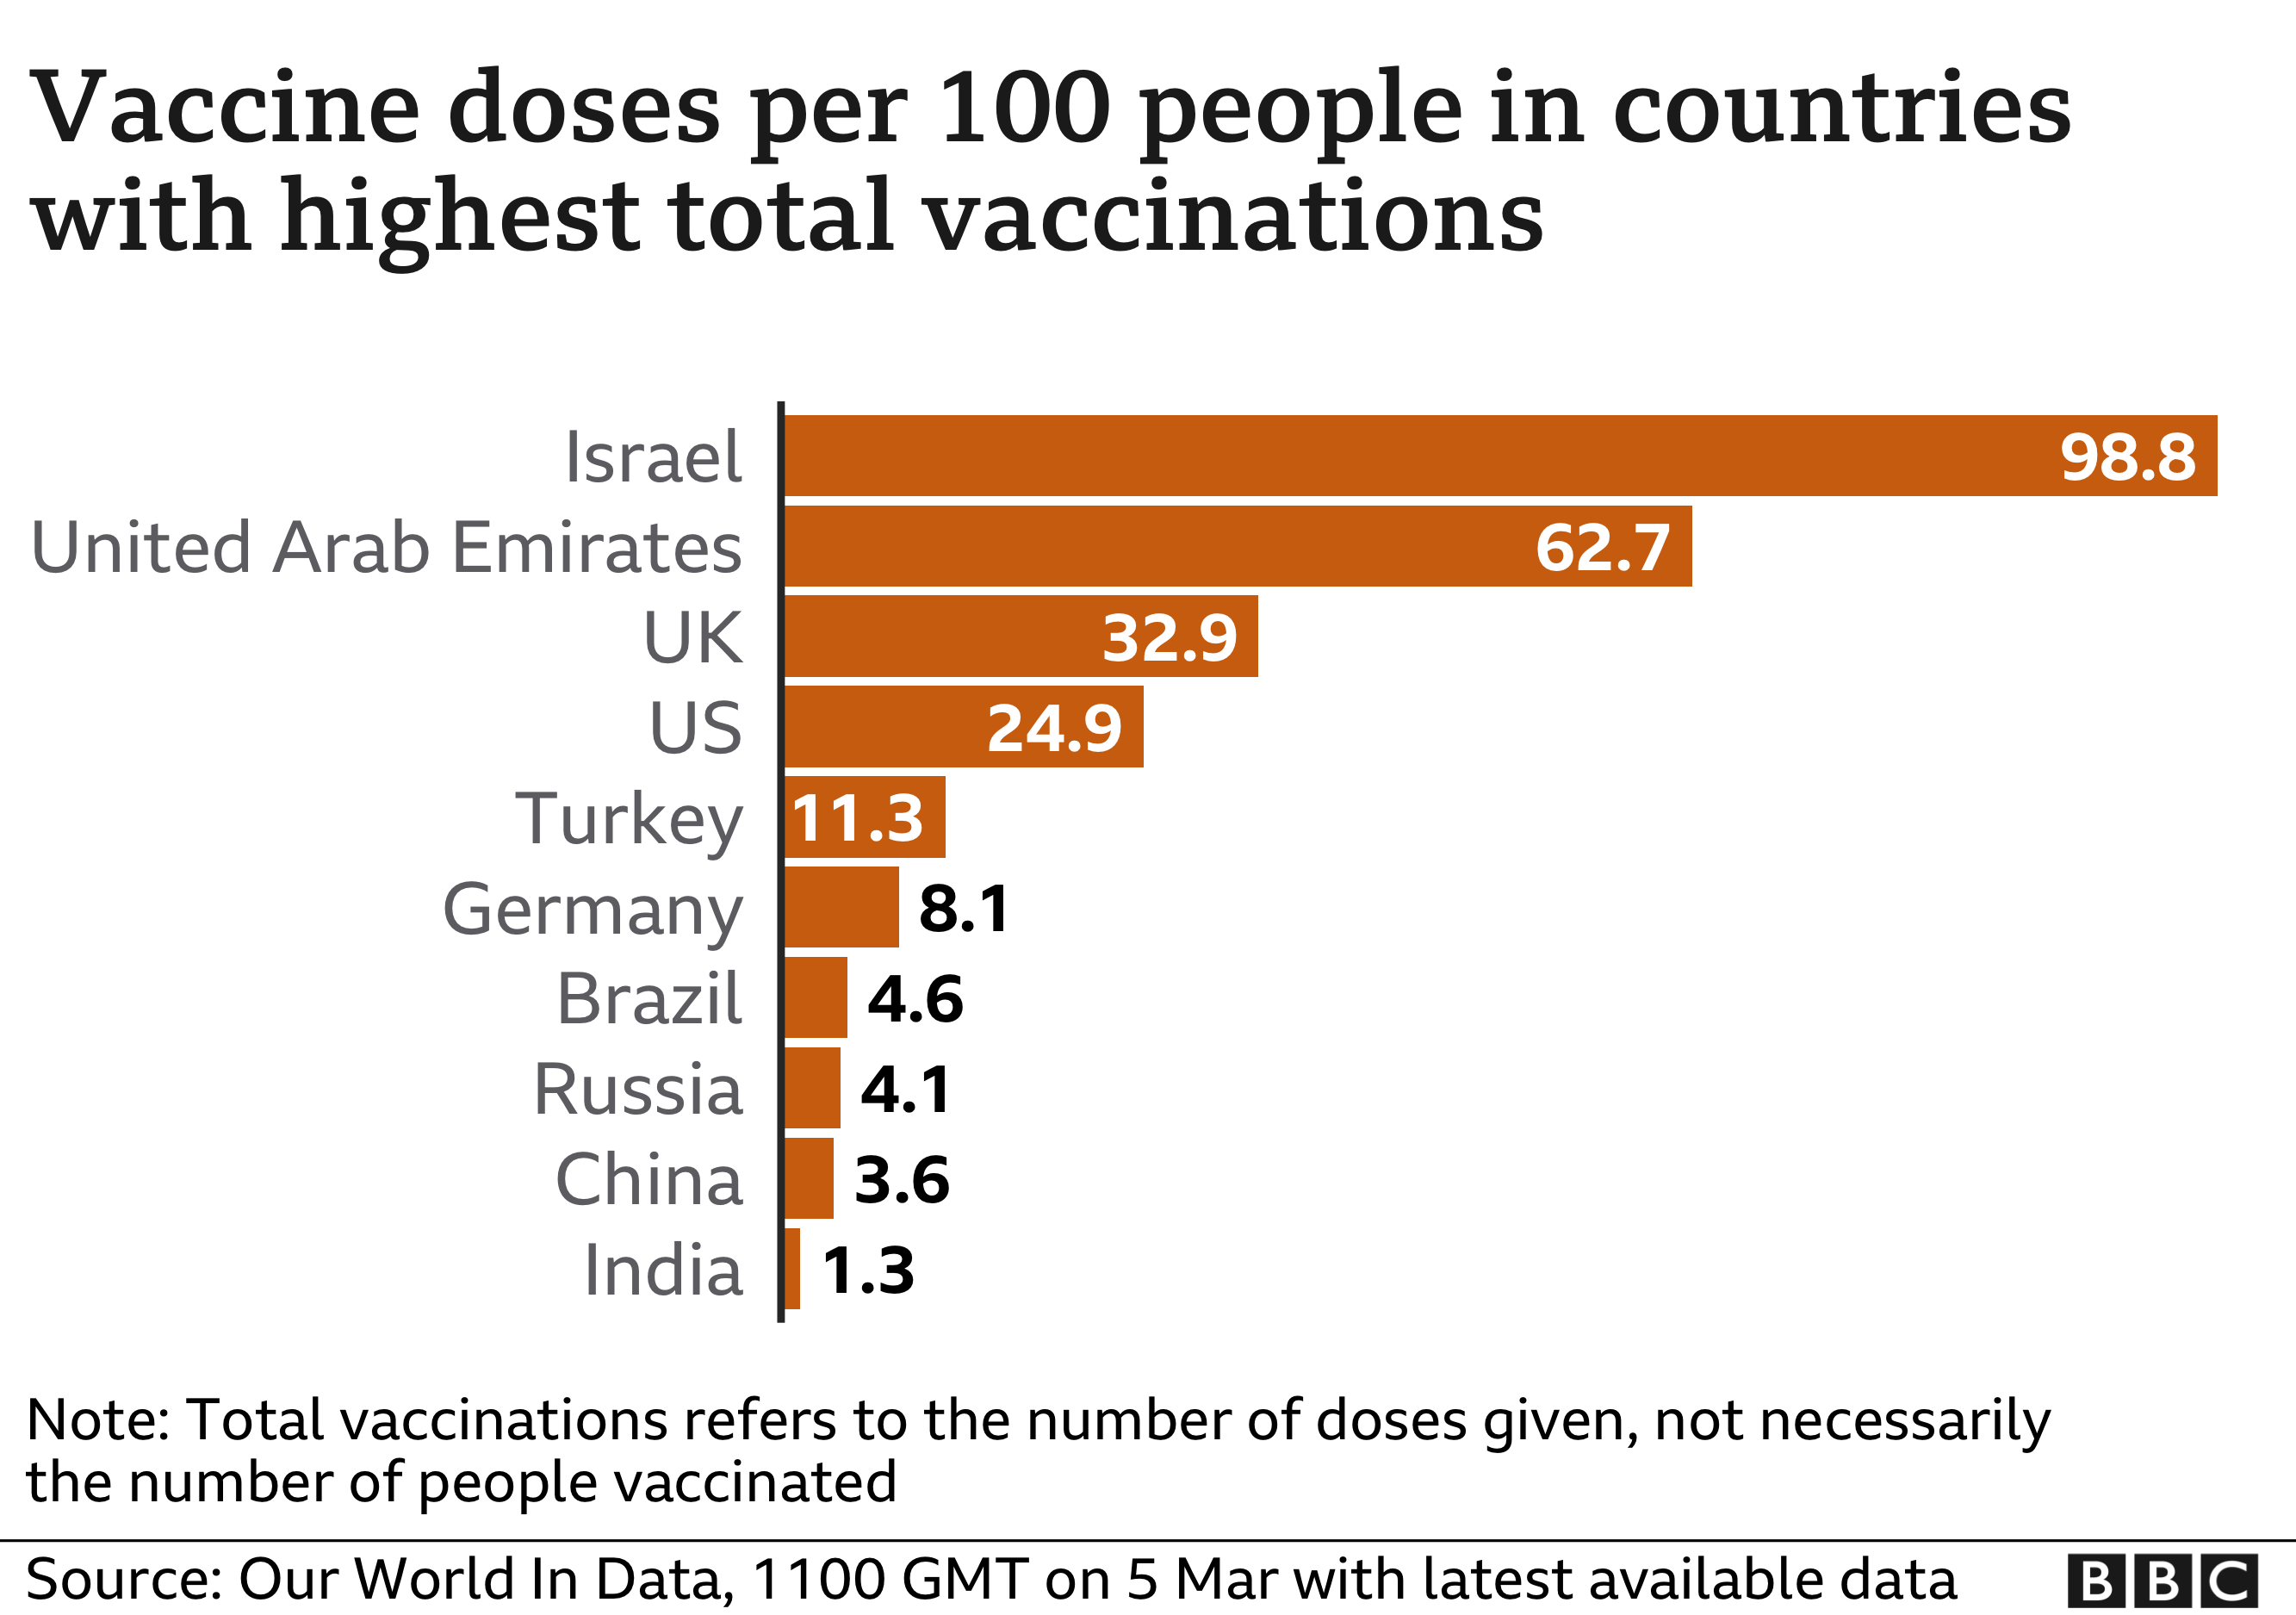
But when breaking the figures down by population, looking at doses administered per 100 people in the 10 countries giving the most vaccinations, Israel, the UAE and the UK top the list - as the chart below shows.
Most countries are prioritising the over-60s, health workers and people who are clinically vulnerable.
Some countries have secured more vaccine doses than their populations need, while other lower-income countries are relying on a global plan known as Covax, which is seeking to ensure everyone in the world has access to a vaccine.
Several African countries have received vaccines through the Covax initiative, with vaccinations now underway in Ghana, Ivory Coast, Nigeria, Kenya and Rwanda.
Global vaccine rollout

Where are cases still high?
As populations across the world await widespread vaccine rollout, cases are either stable or falling in most regions at the moment.
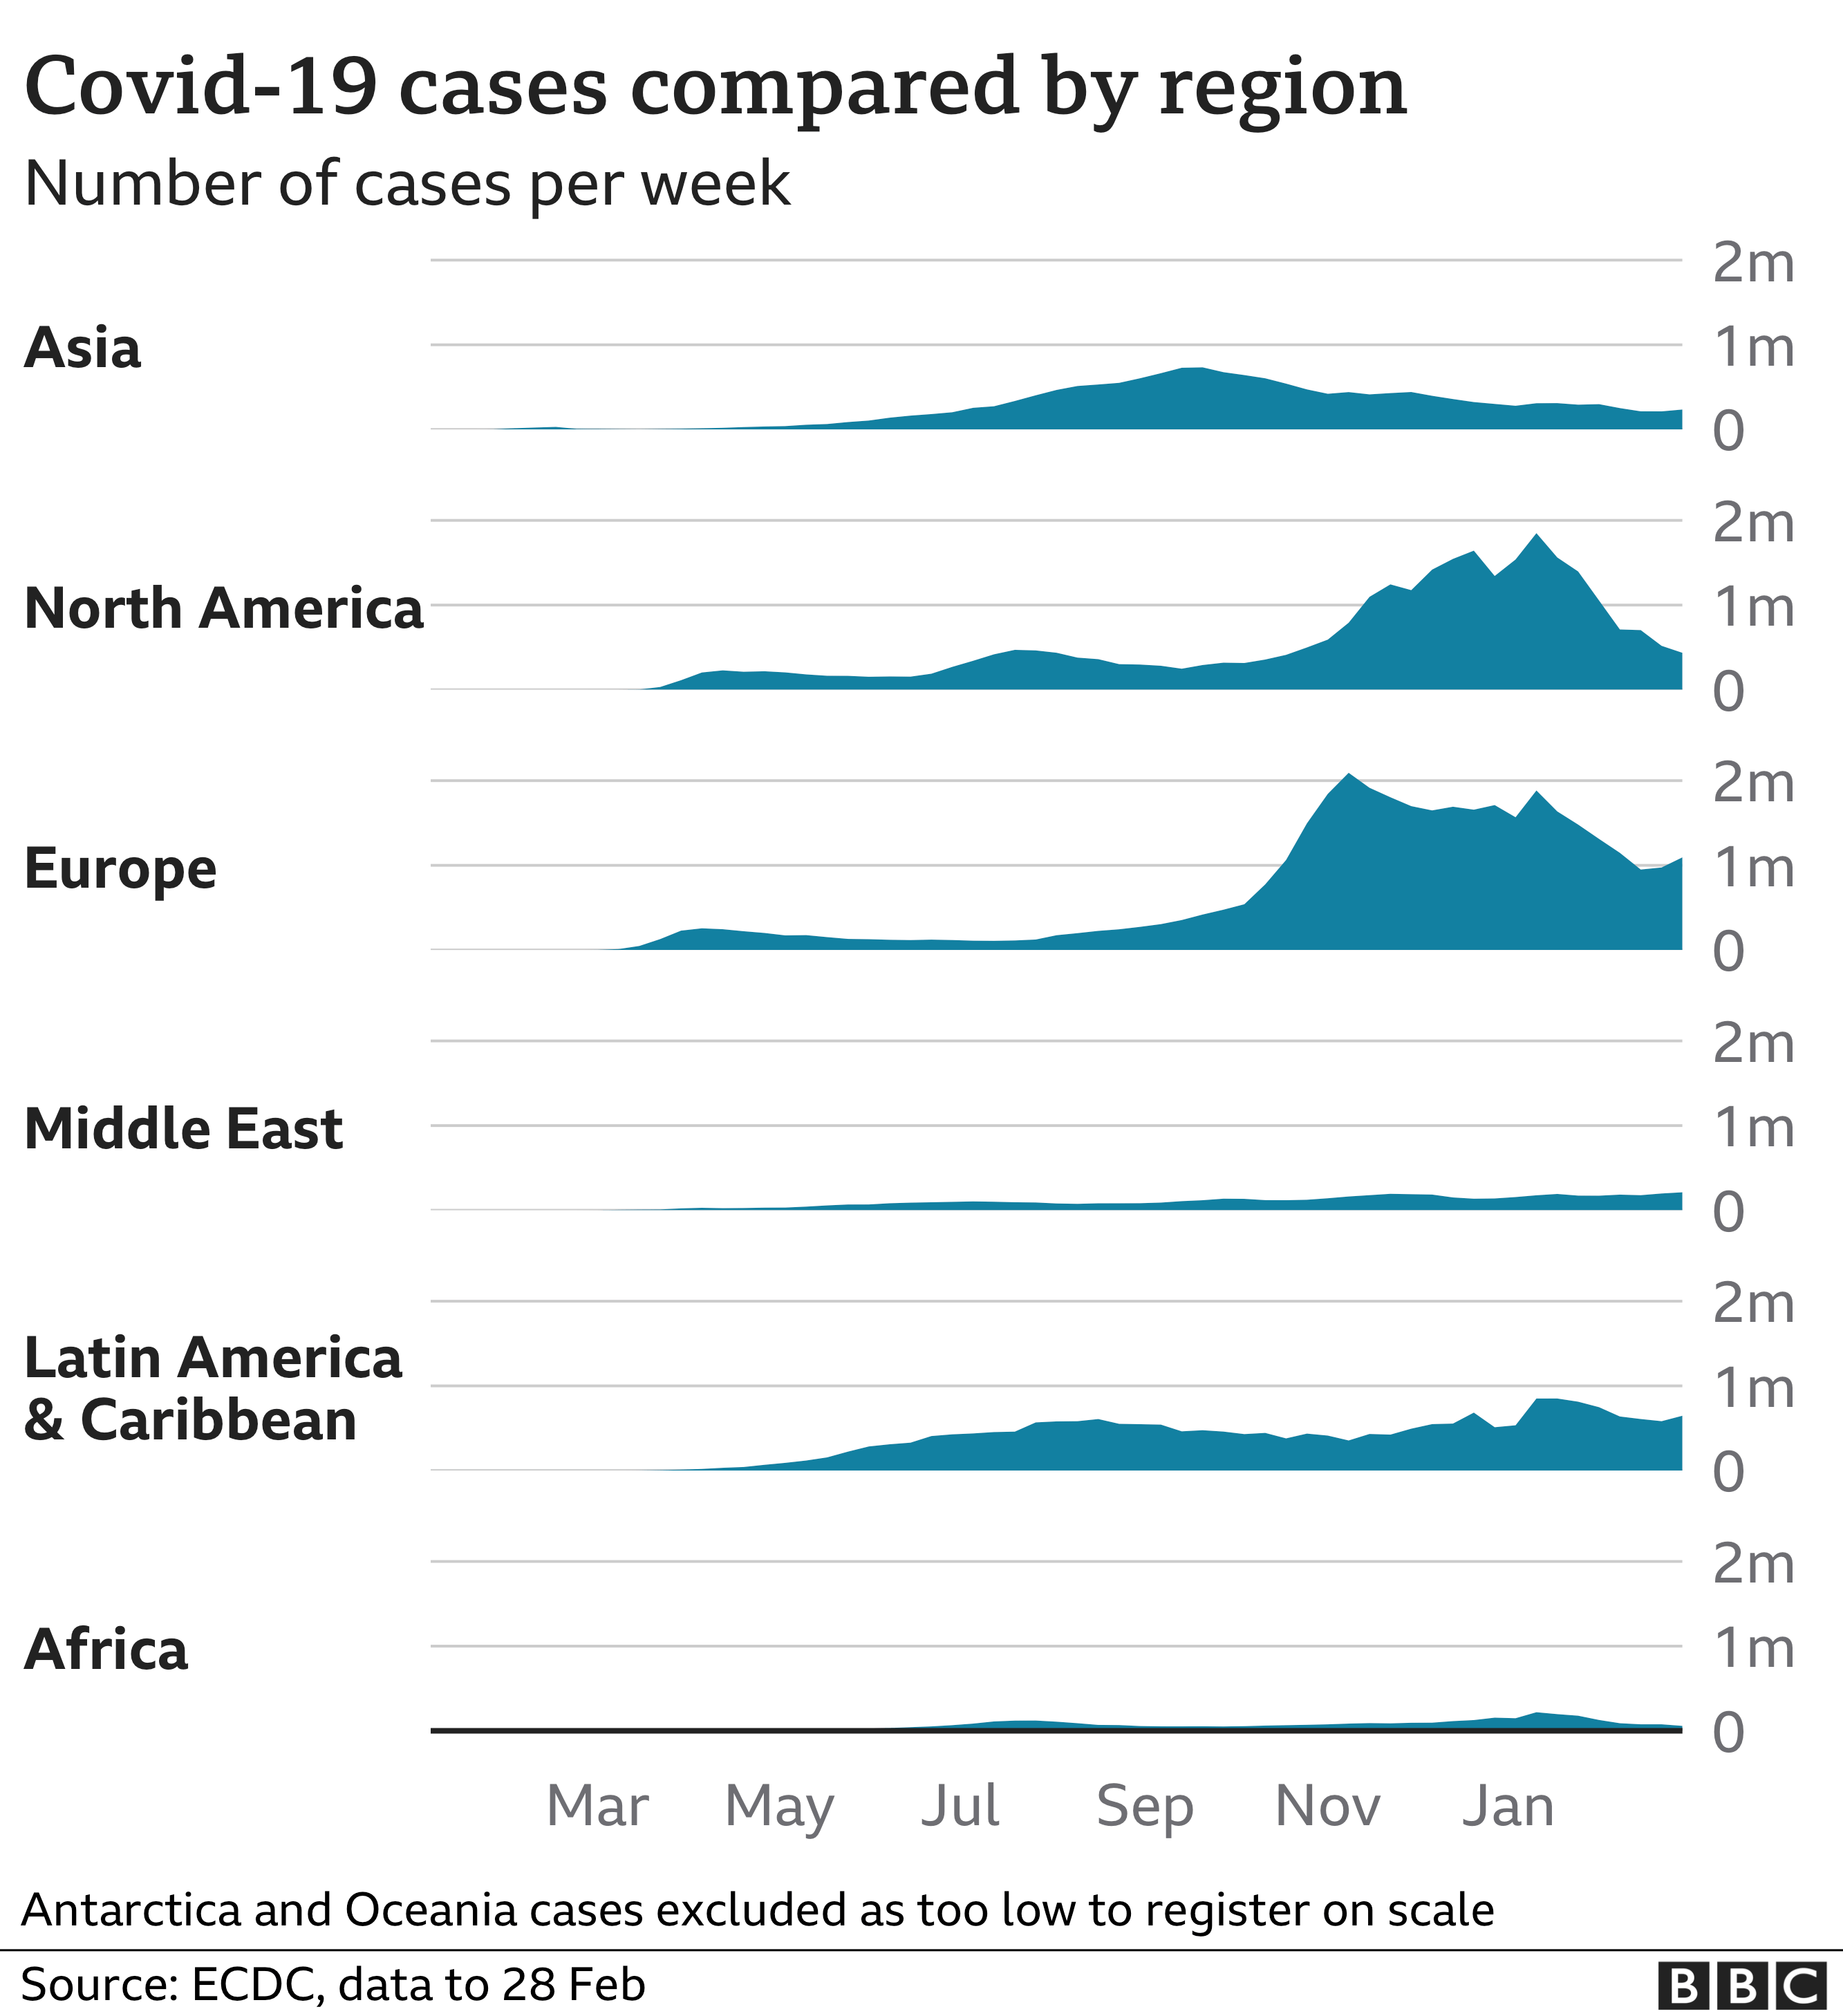
Here's a breakdown of the situation by region:
Europe
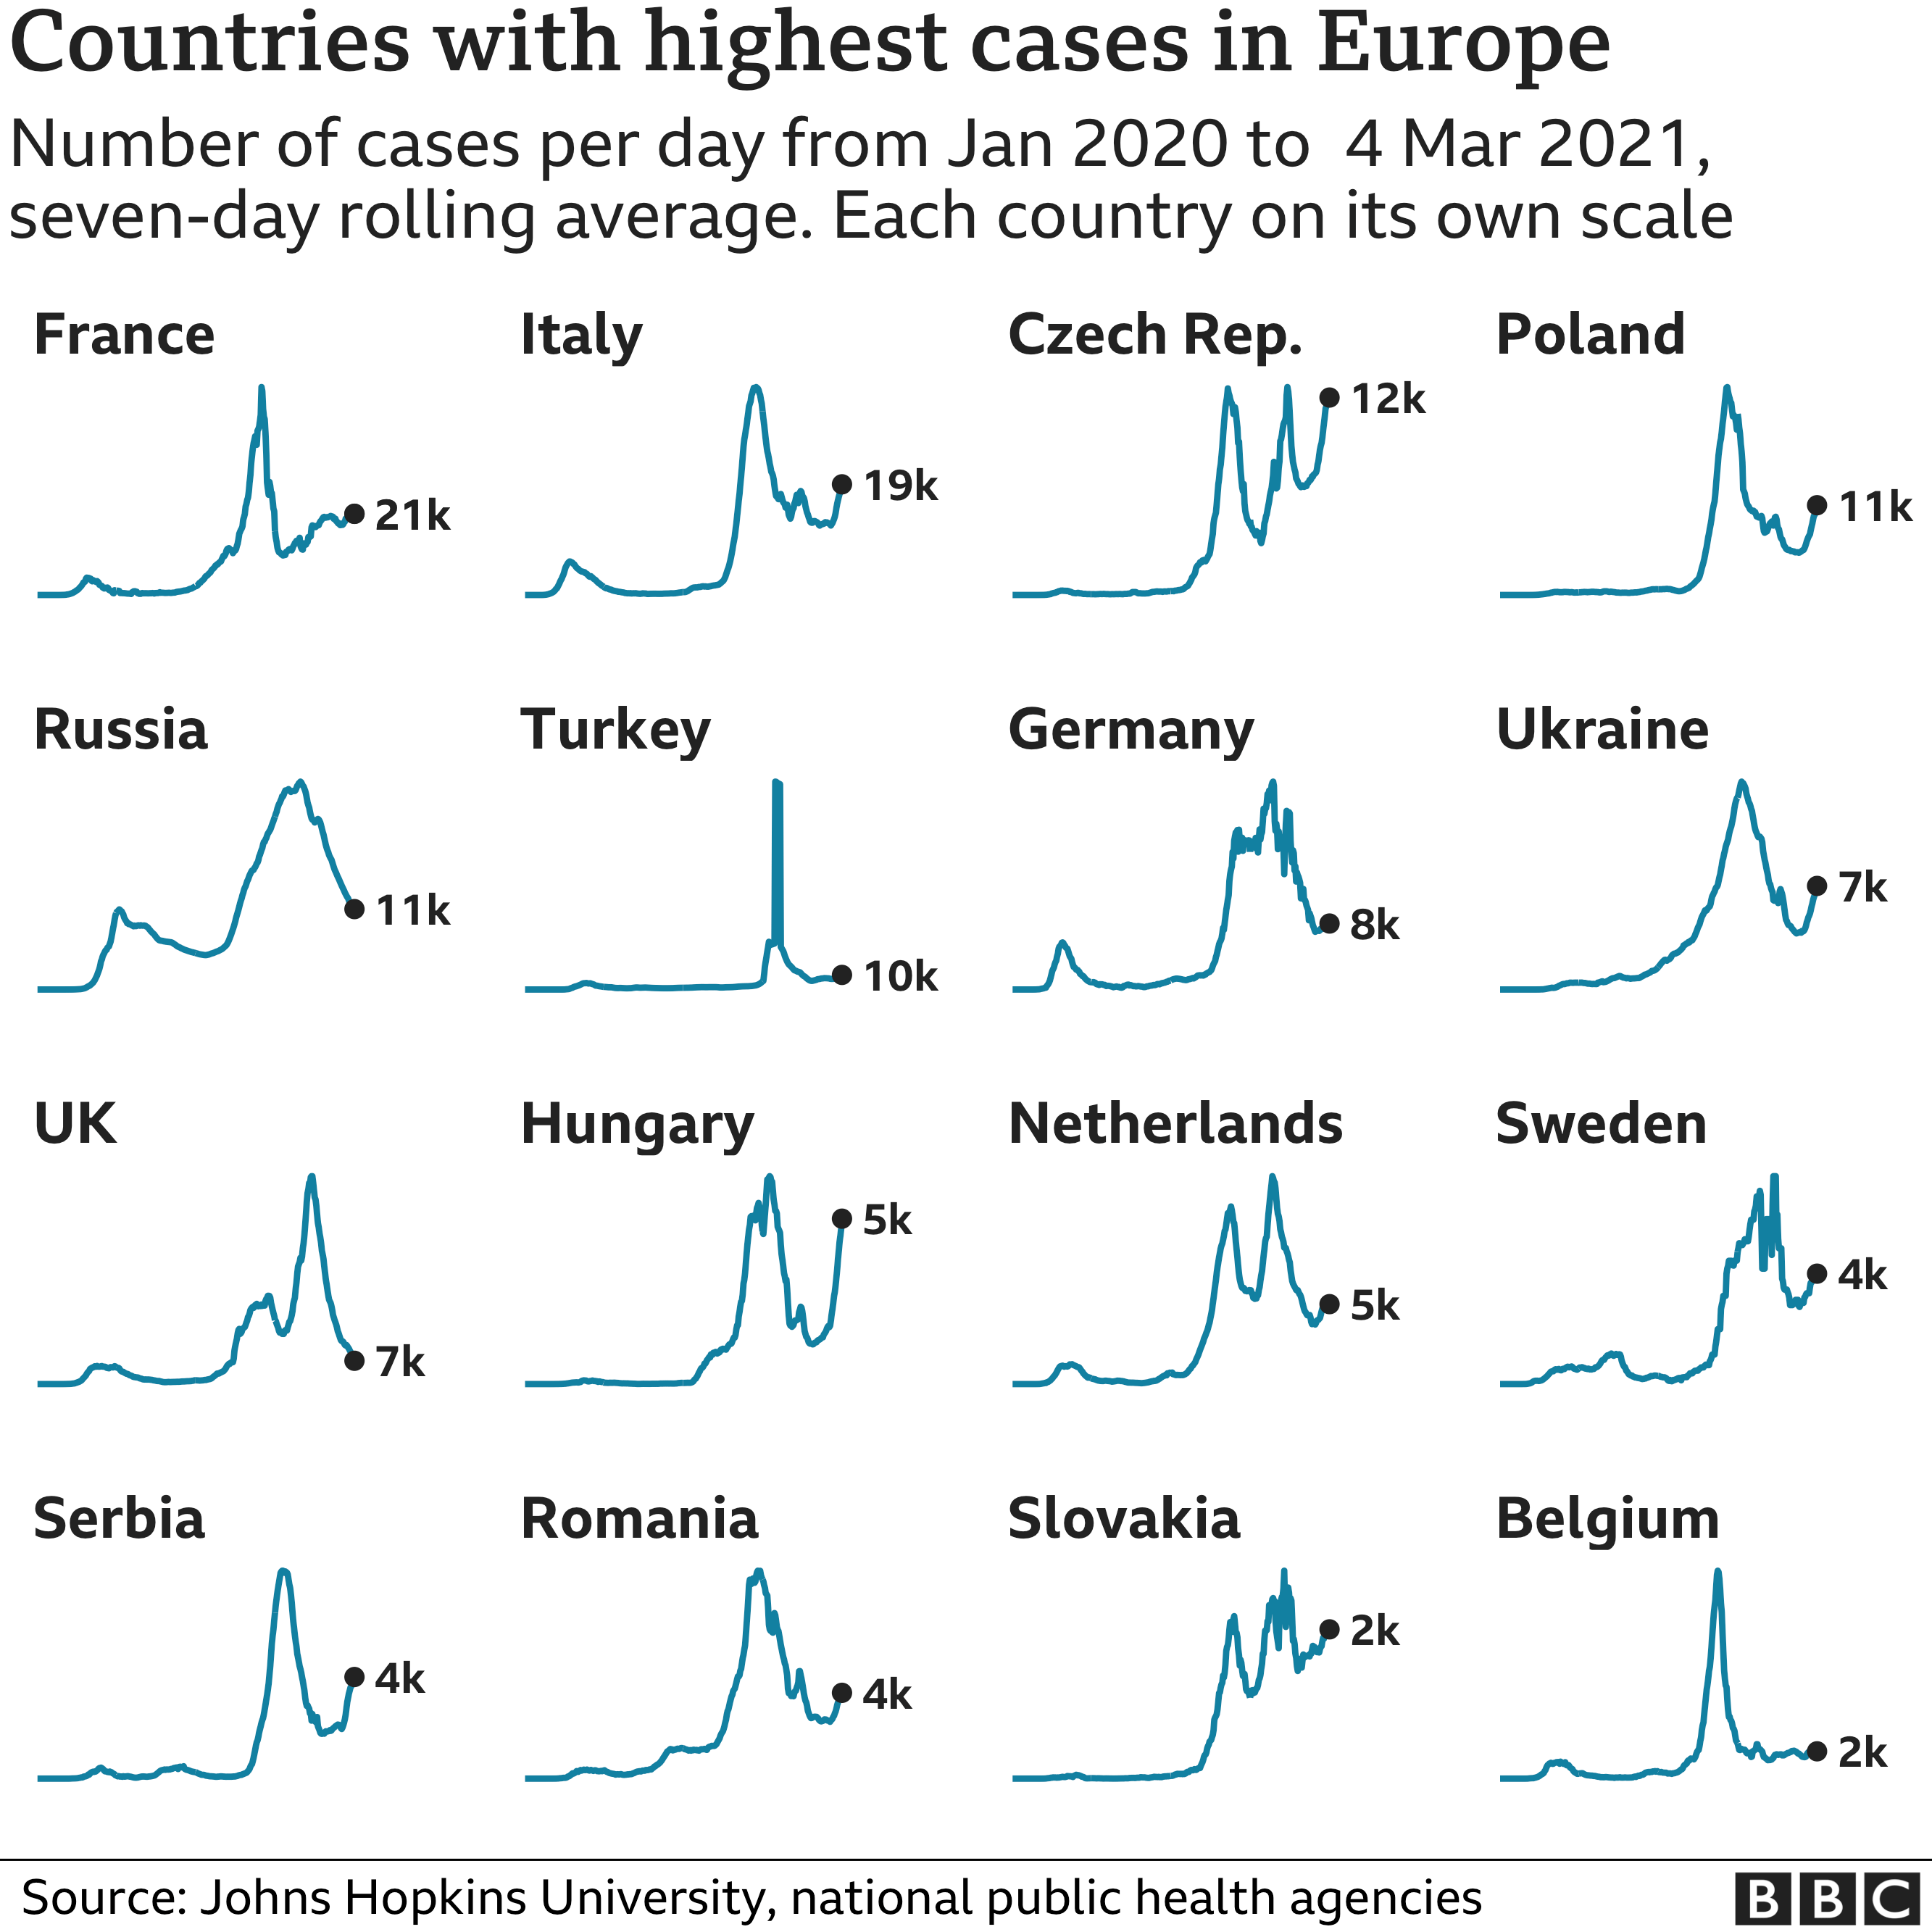
Daily cases had been falling in most European countries earlier this month, but several are now seeing a rise in infections.
France, Italy, the Czech Republic and Poland have seen the highest numbers in recent weeks.
Lockdown measures were tightened in many of the worst-affected countries over the winter but some restrictions are now being lifted.
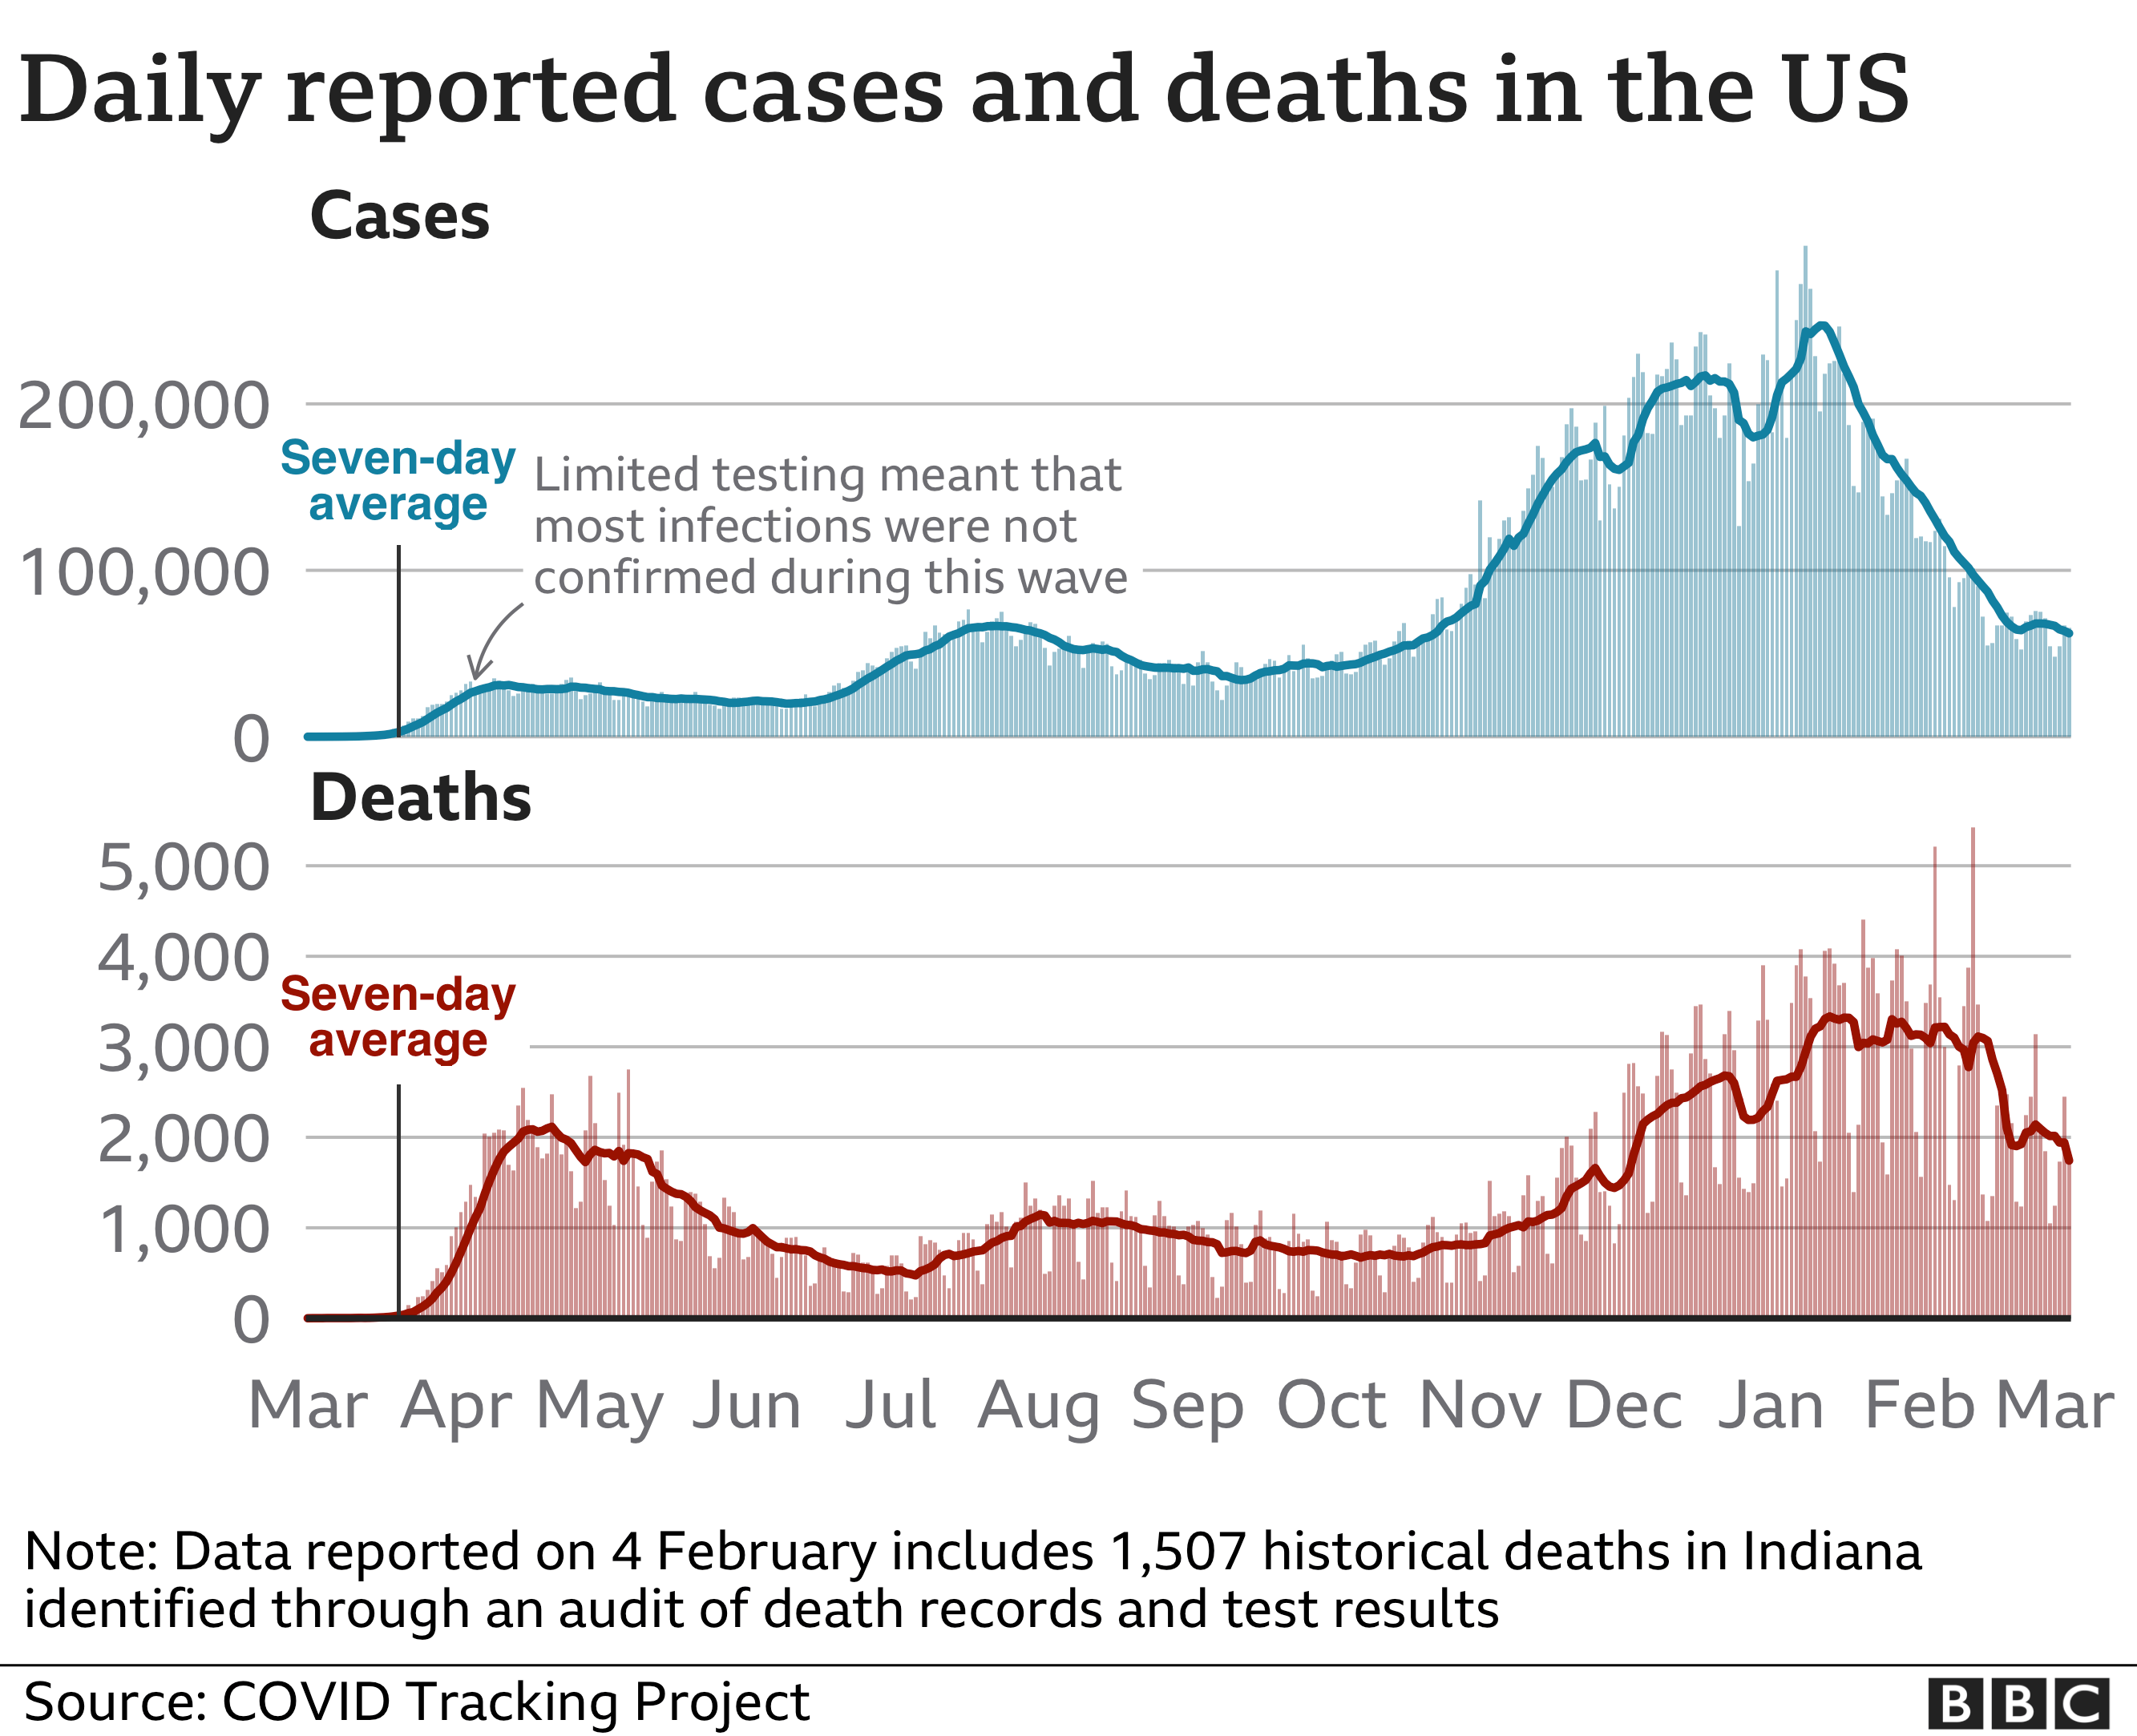
North America
The US has recorded nearly 30 million cases and more than 520,000 deaths, the highest figures in the world.
Daily cases were at record levels in early January but they have fallen substantially in the last few weeks.
Canada, which has a far lower death rate than the US, also experienced a winter surge but daily cases have also been falling recently.
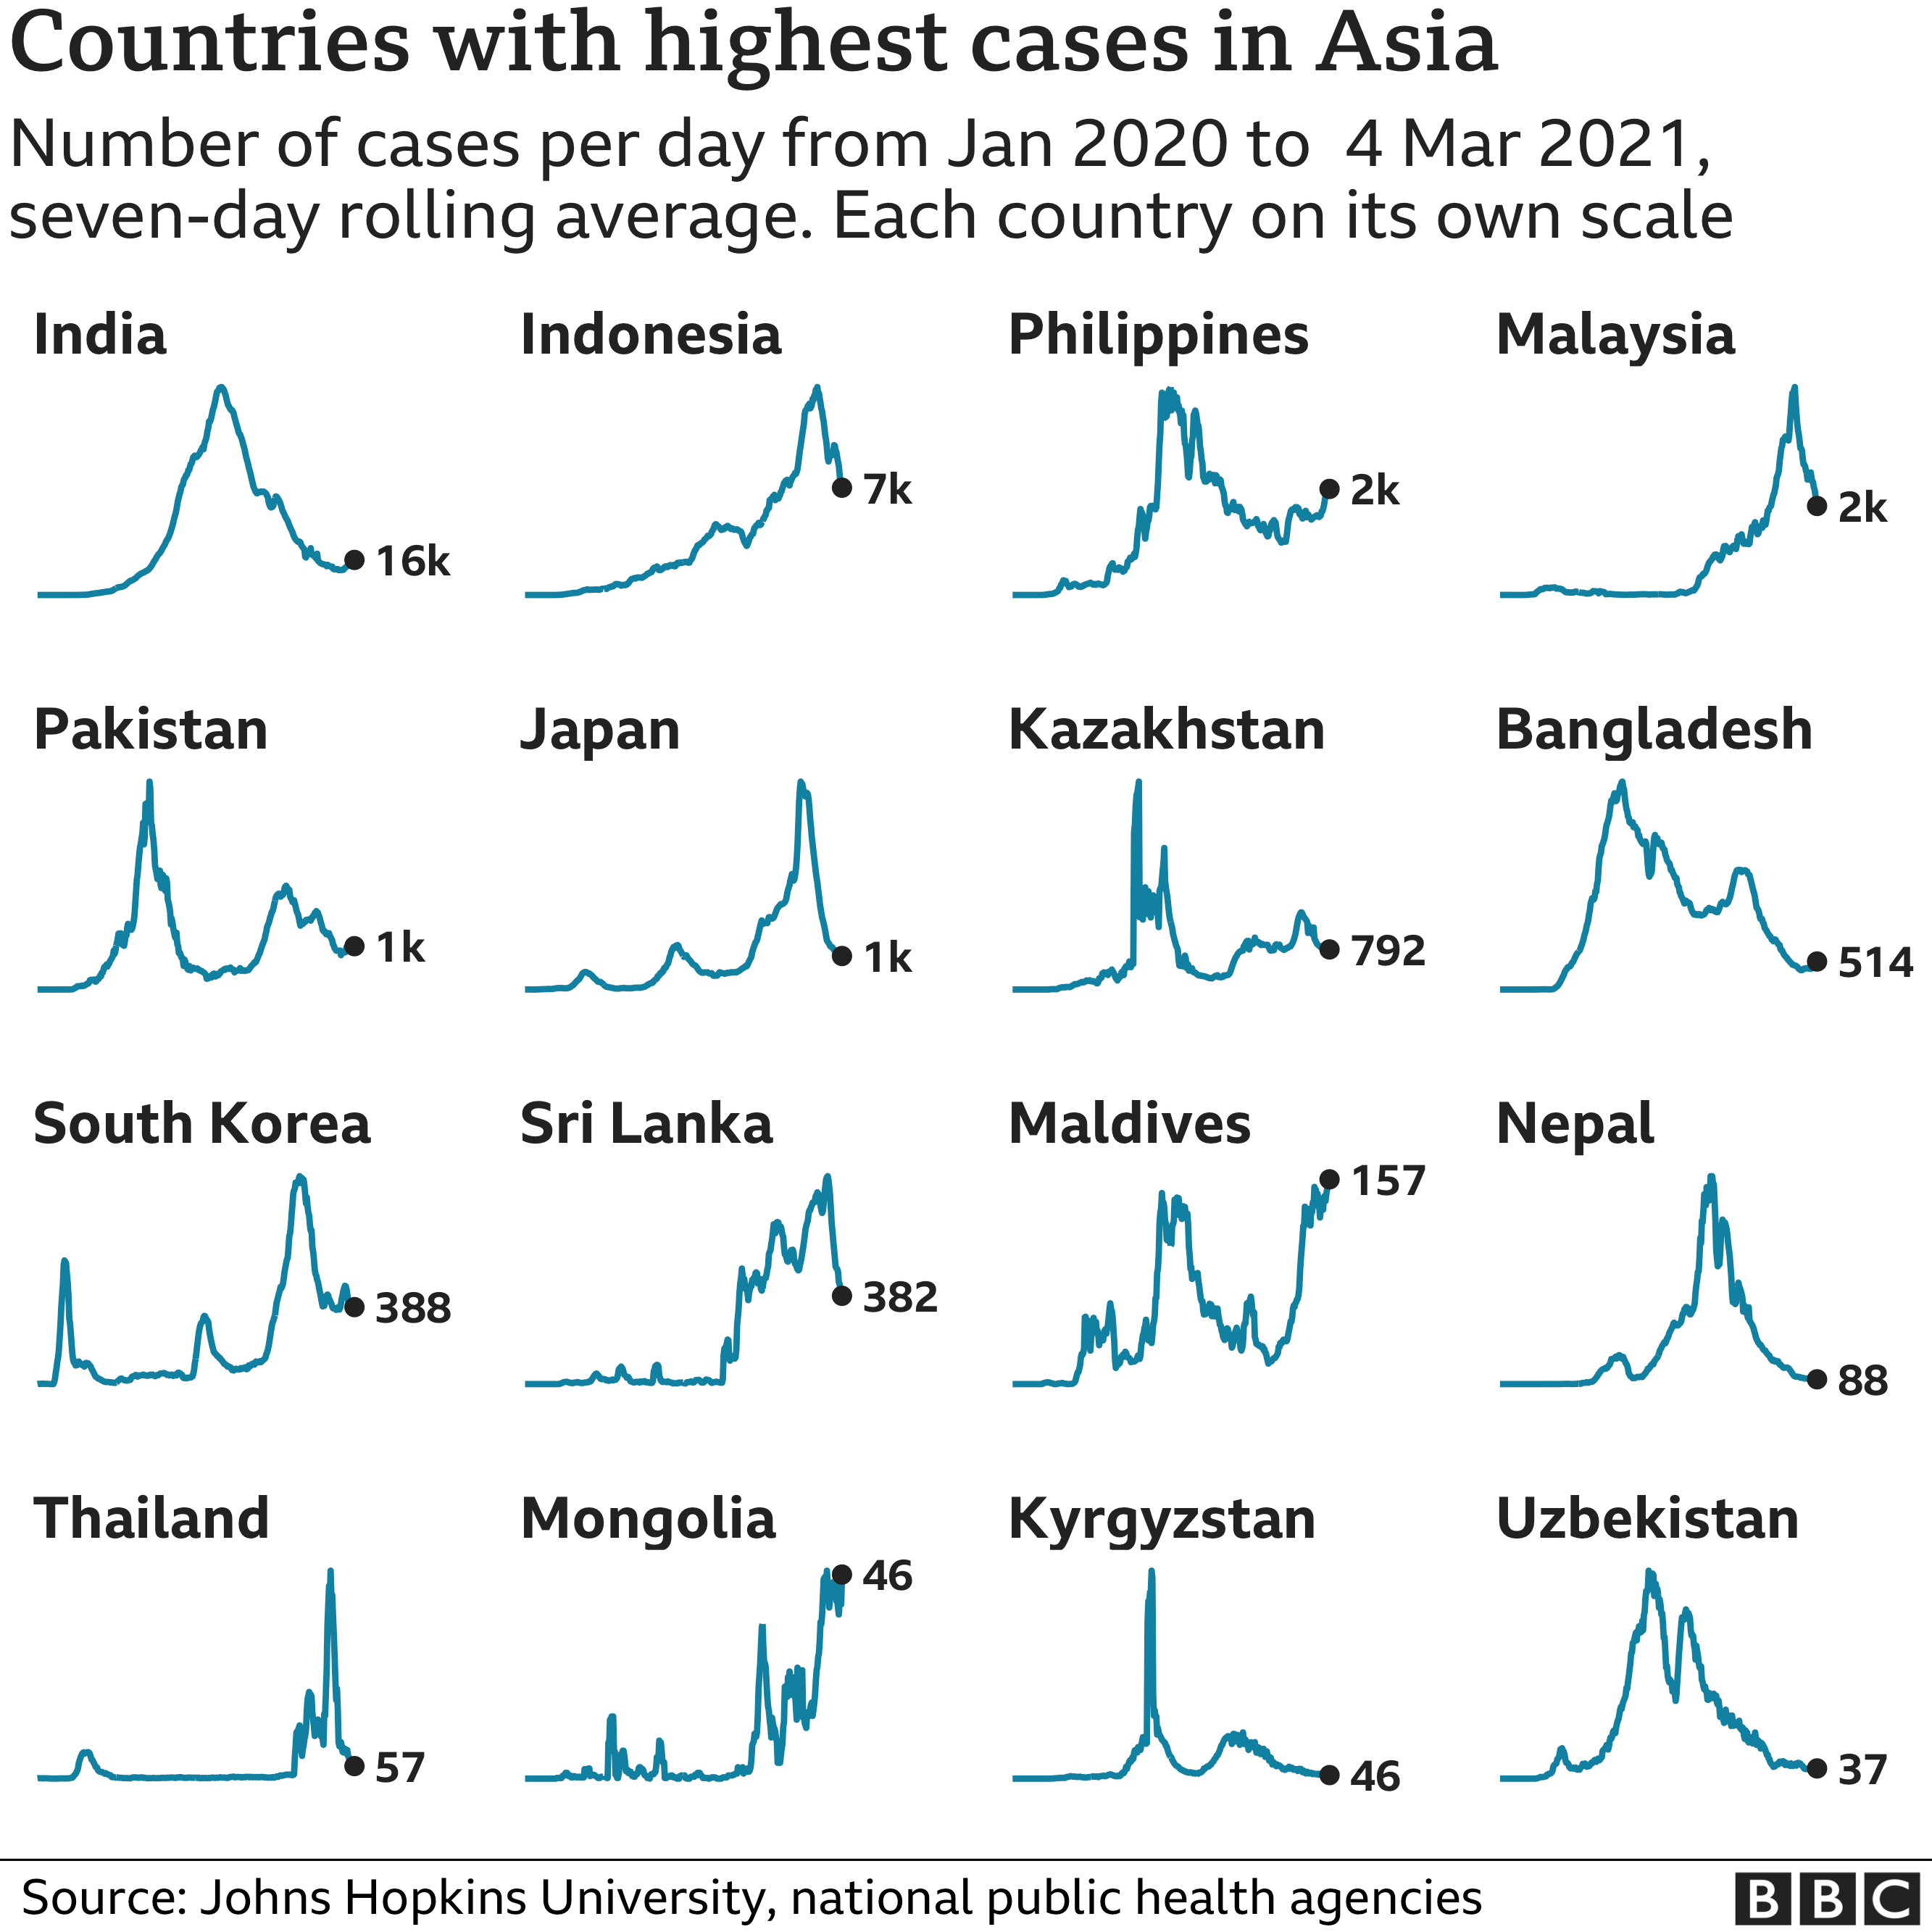
Asia
Asia was the centre of the initial outbreak that spread from China in early 2020, but the number of cases and deaths there has been lower than in Europe and North America.
The region saw a large rise in the number of cases last autumn, driven by a surge in infections in India, one of the most densely populated countries in the world.
India has seen more than 11 million confirmed cases, the second-highest in the world after the US, but the number of daily infections has fallen in recent months.
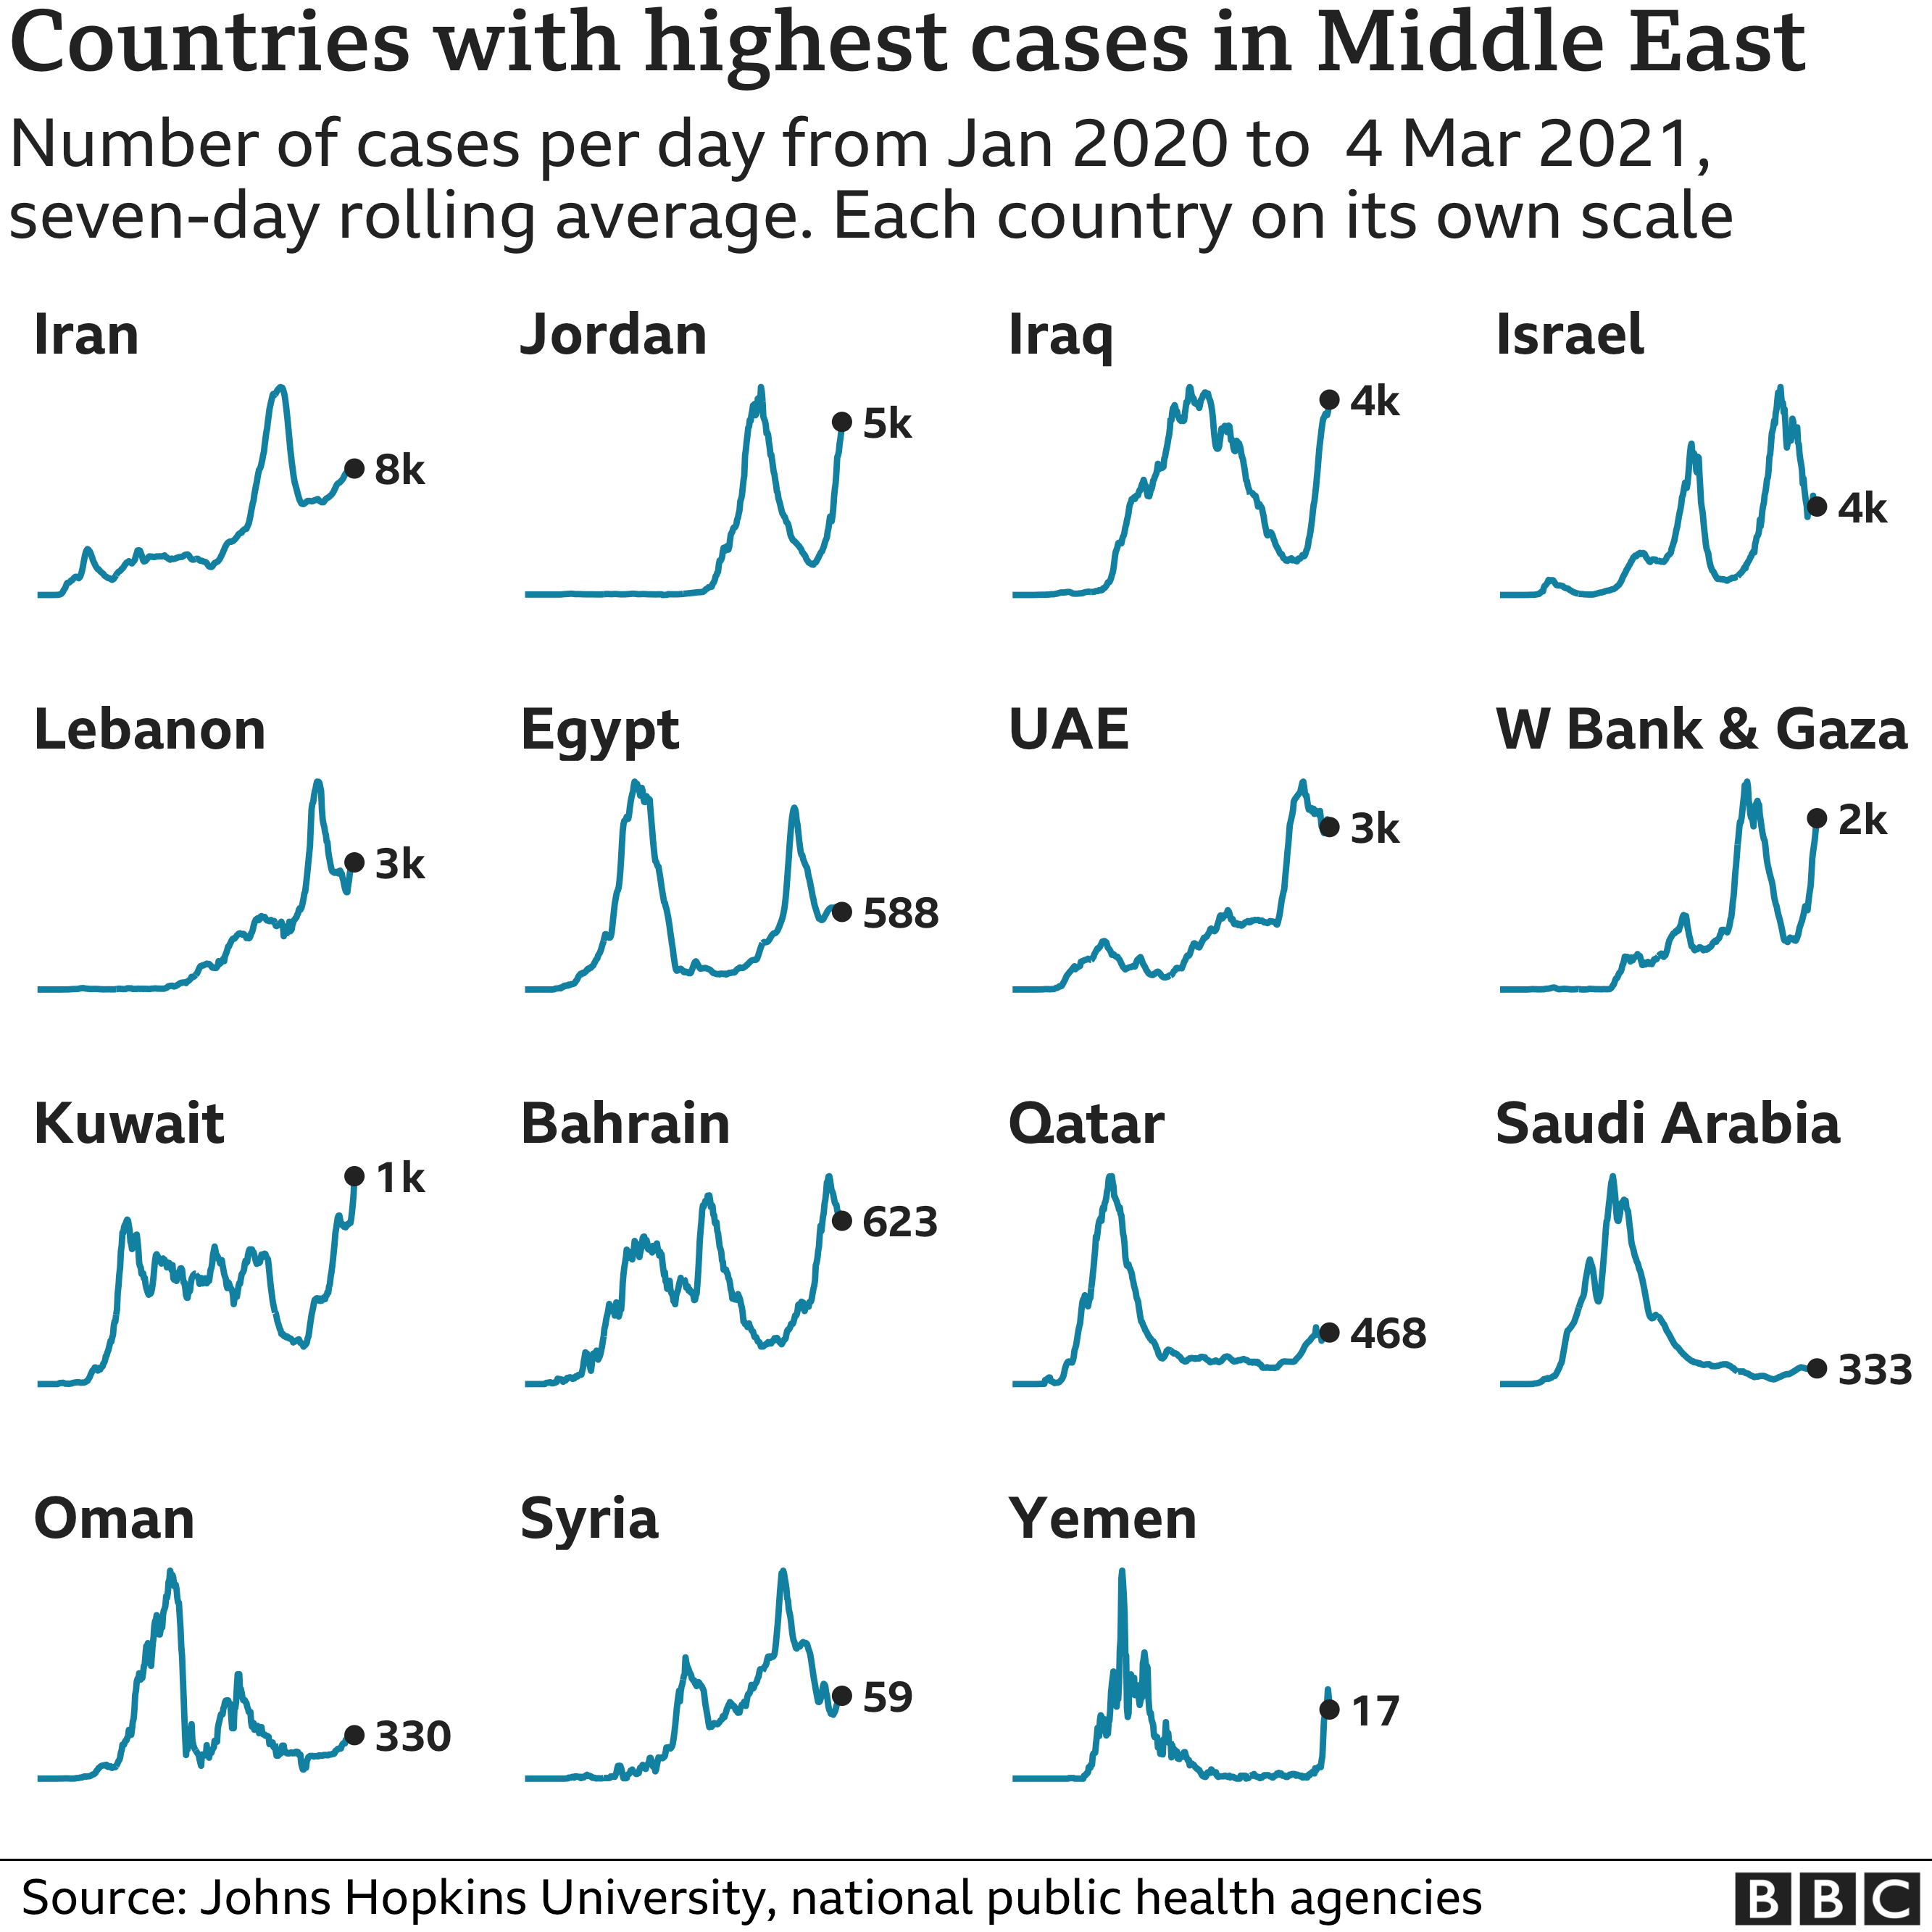
Middle East
Several countries in the Middle East have had deadly coronavirus outbreaks over the past 12 months, with Iran and Israel having seen the highest numbers.
Cases have fallen in Israel but several countries in the region are currently seeing renewed outbreaks, including Iran and Jordan.
Israel's efforts to reduce the number of cases have been boosted by the country's highly successful vaccination programme.
Iraq, which has seen a rise in cases in recent weeks, began rolling out its vaccination programme on Tuesday.
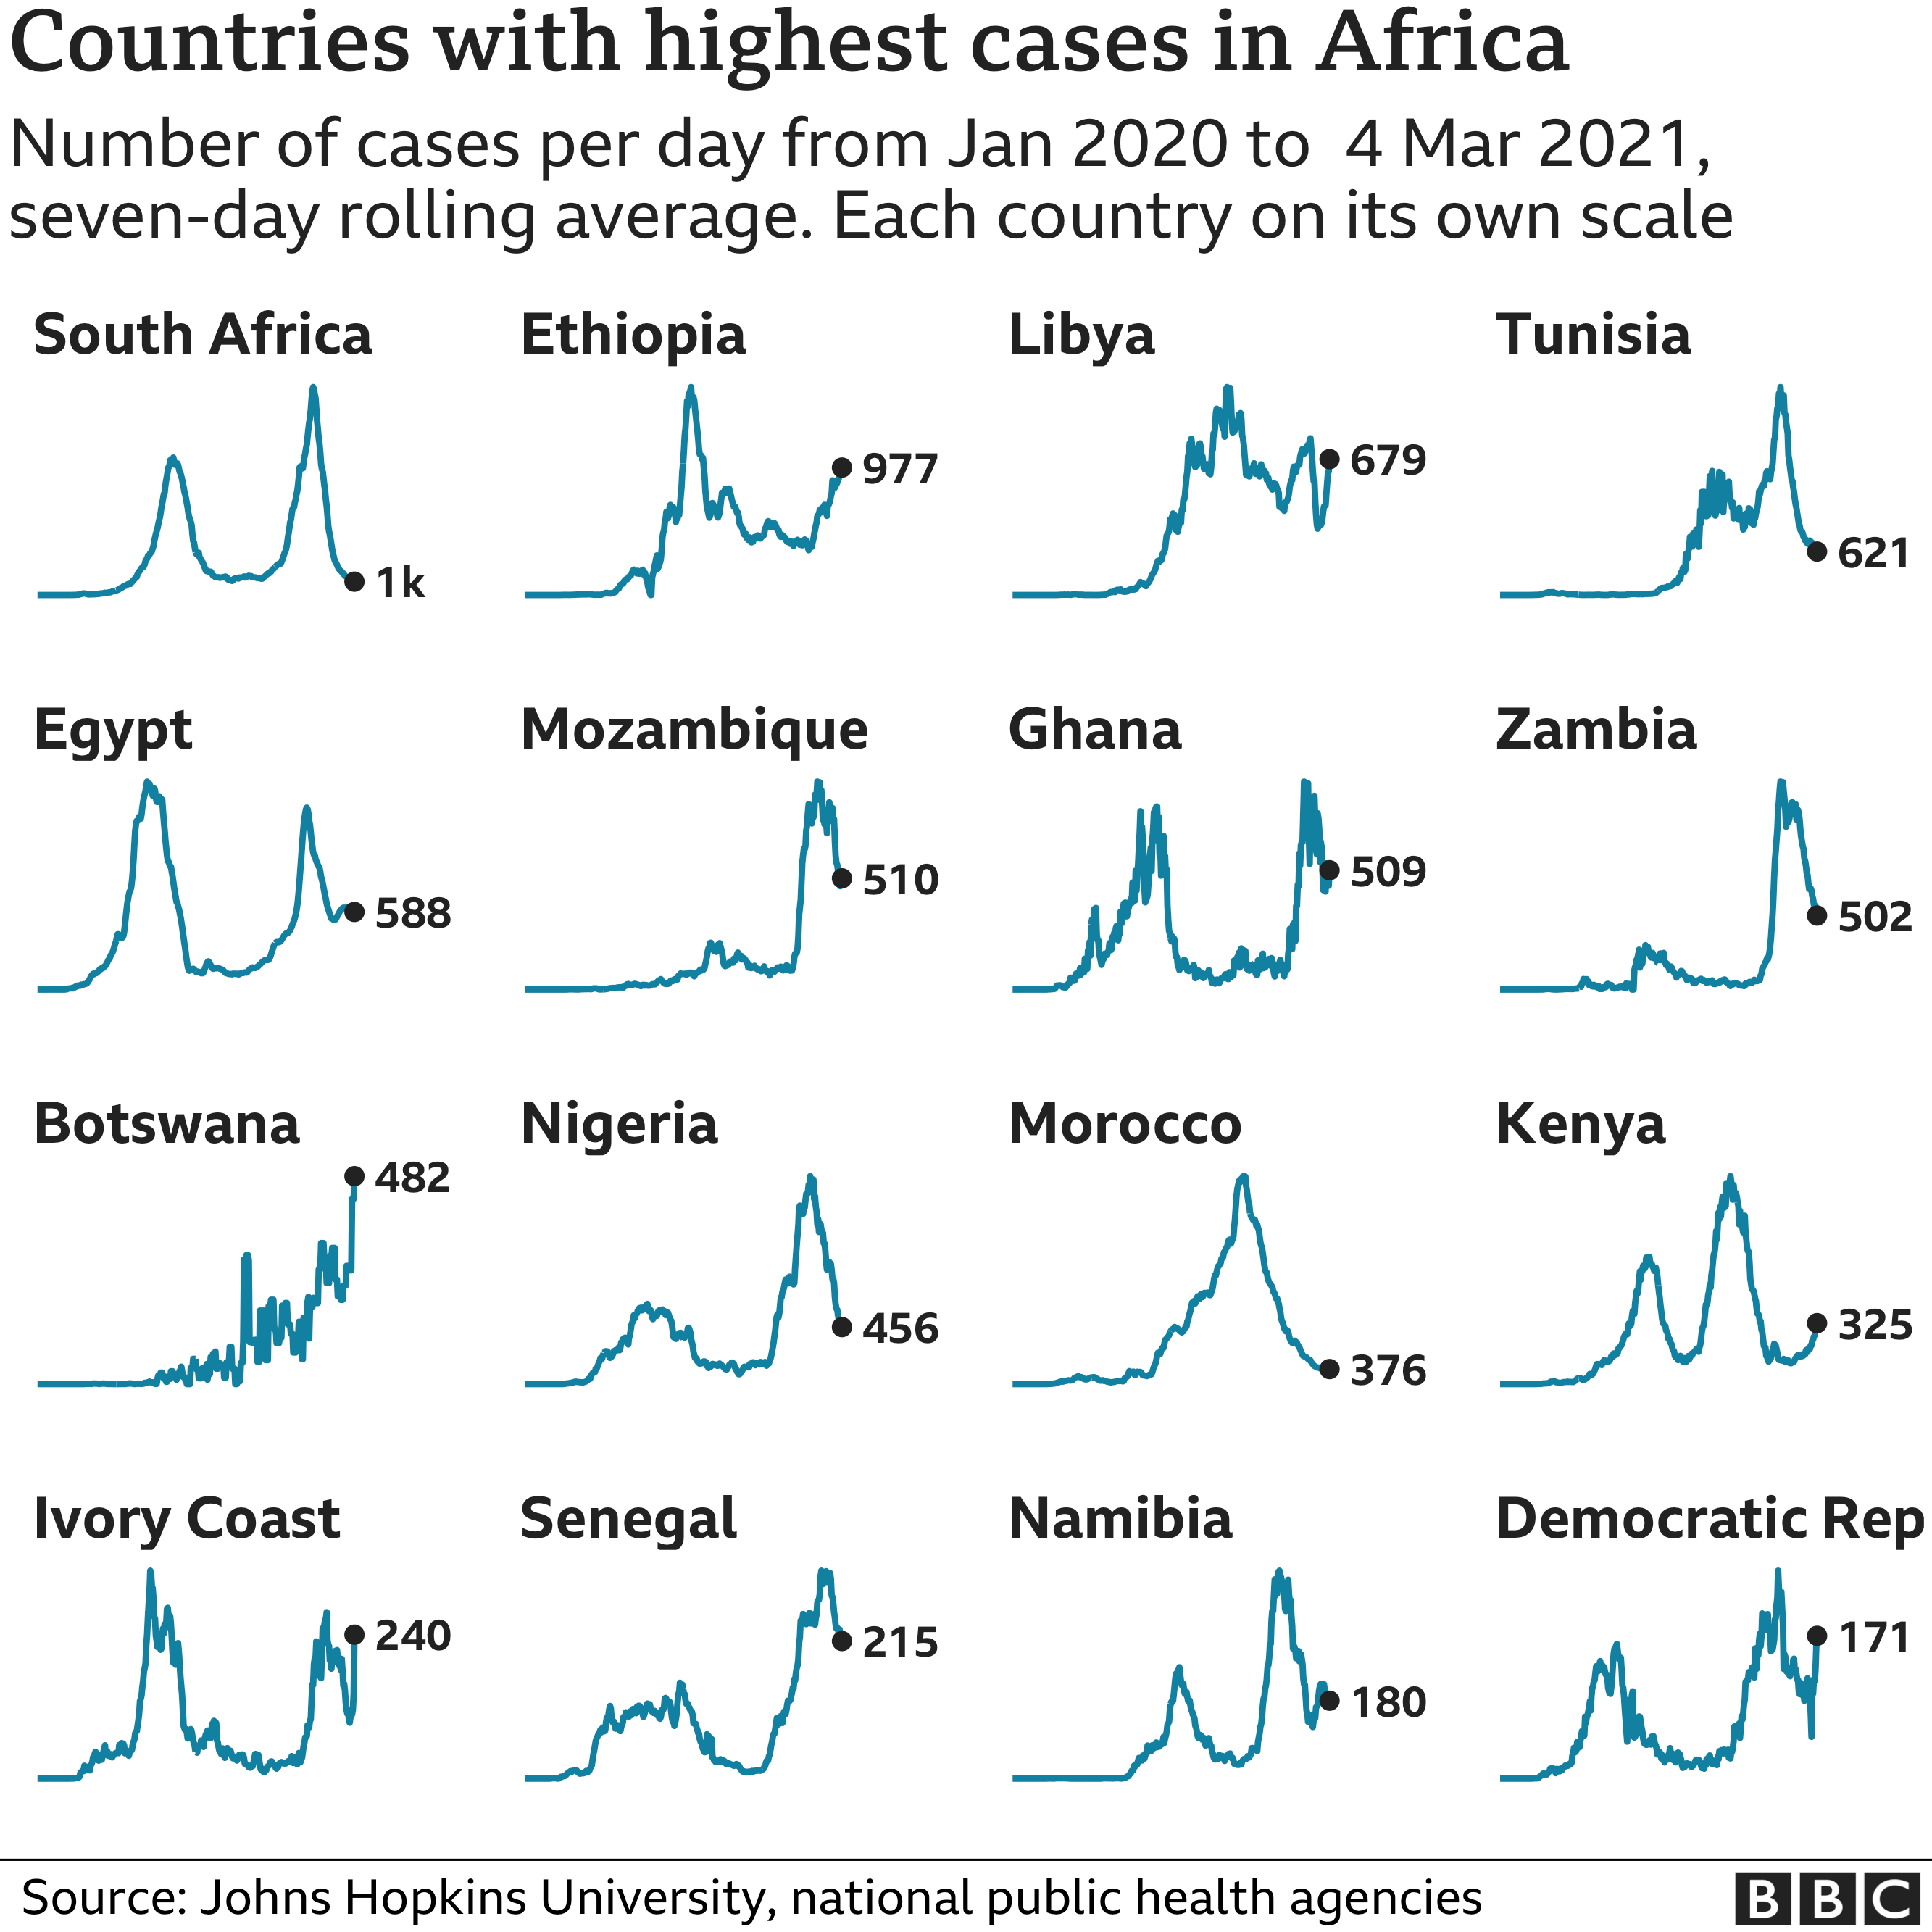
Africa
Africa has recorded nearly four million cases and more than 100,000 deaths - but the true extent of the pandemic in many African countries is not known as testing rates are low.
South Africa, with more than 1.5 million cases, is the worst affected country on the continent, according to official figures.
Morocco, Egypt, Ethiopia, Tunisia, Libya, Algeria, Nigeria and Kenya have also recorded more than 100,000 cases.
Ivory Coast became the first country to roll out vaccines offered by UN-backed Covax programme, starting with healthcare workers on Monday.
Ghana, Nigeria, Kenya and Rwanda also began administering vaccines this week, whilst Angola, the Democratic Republic of Congo and Gambia have also received supplies.
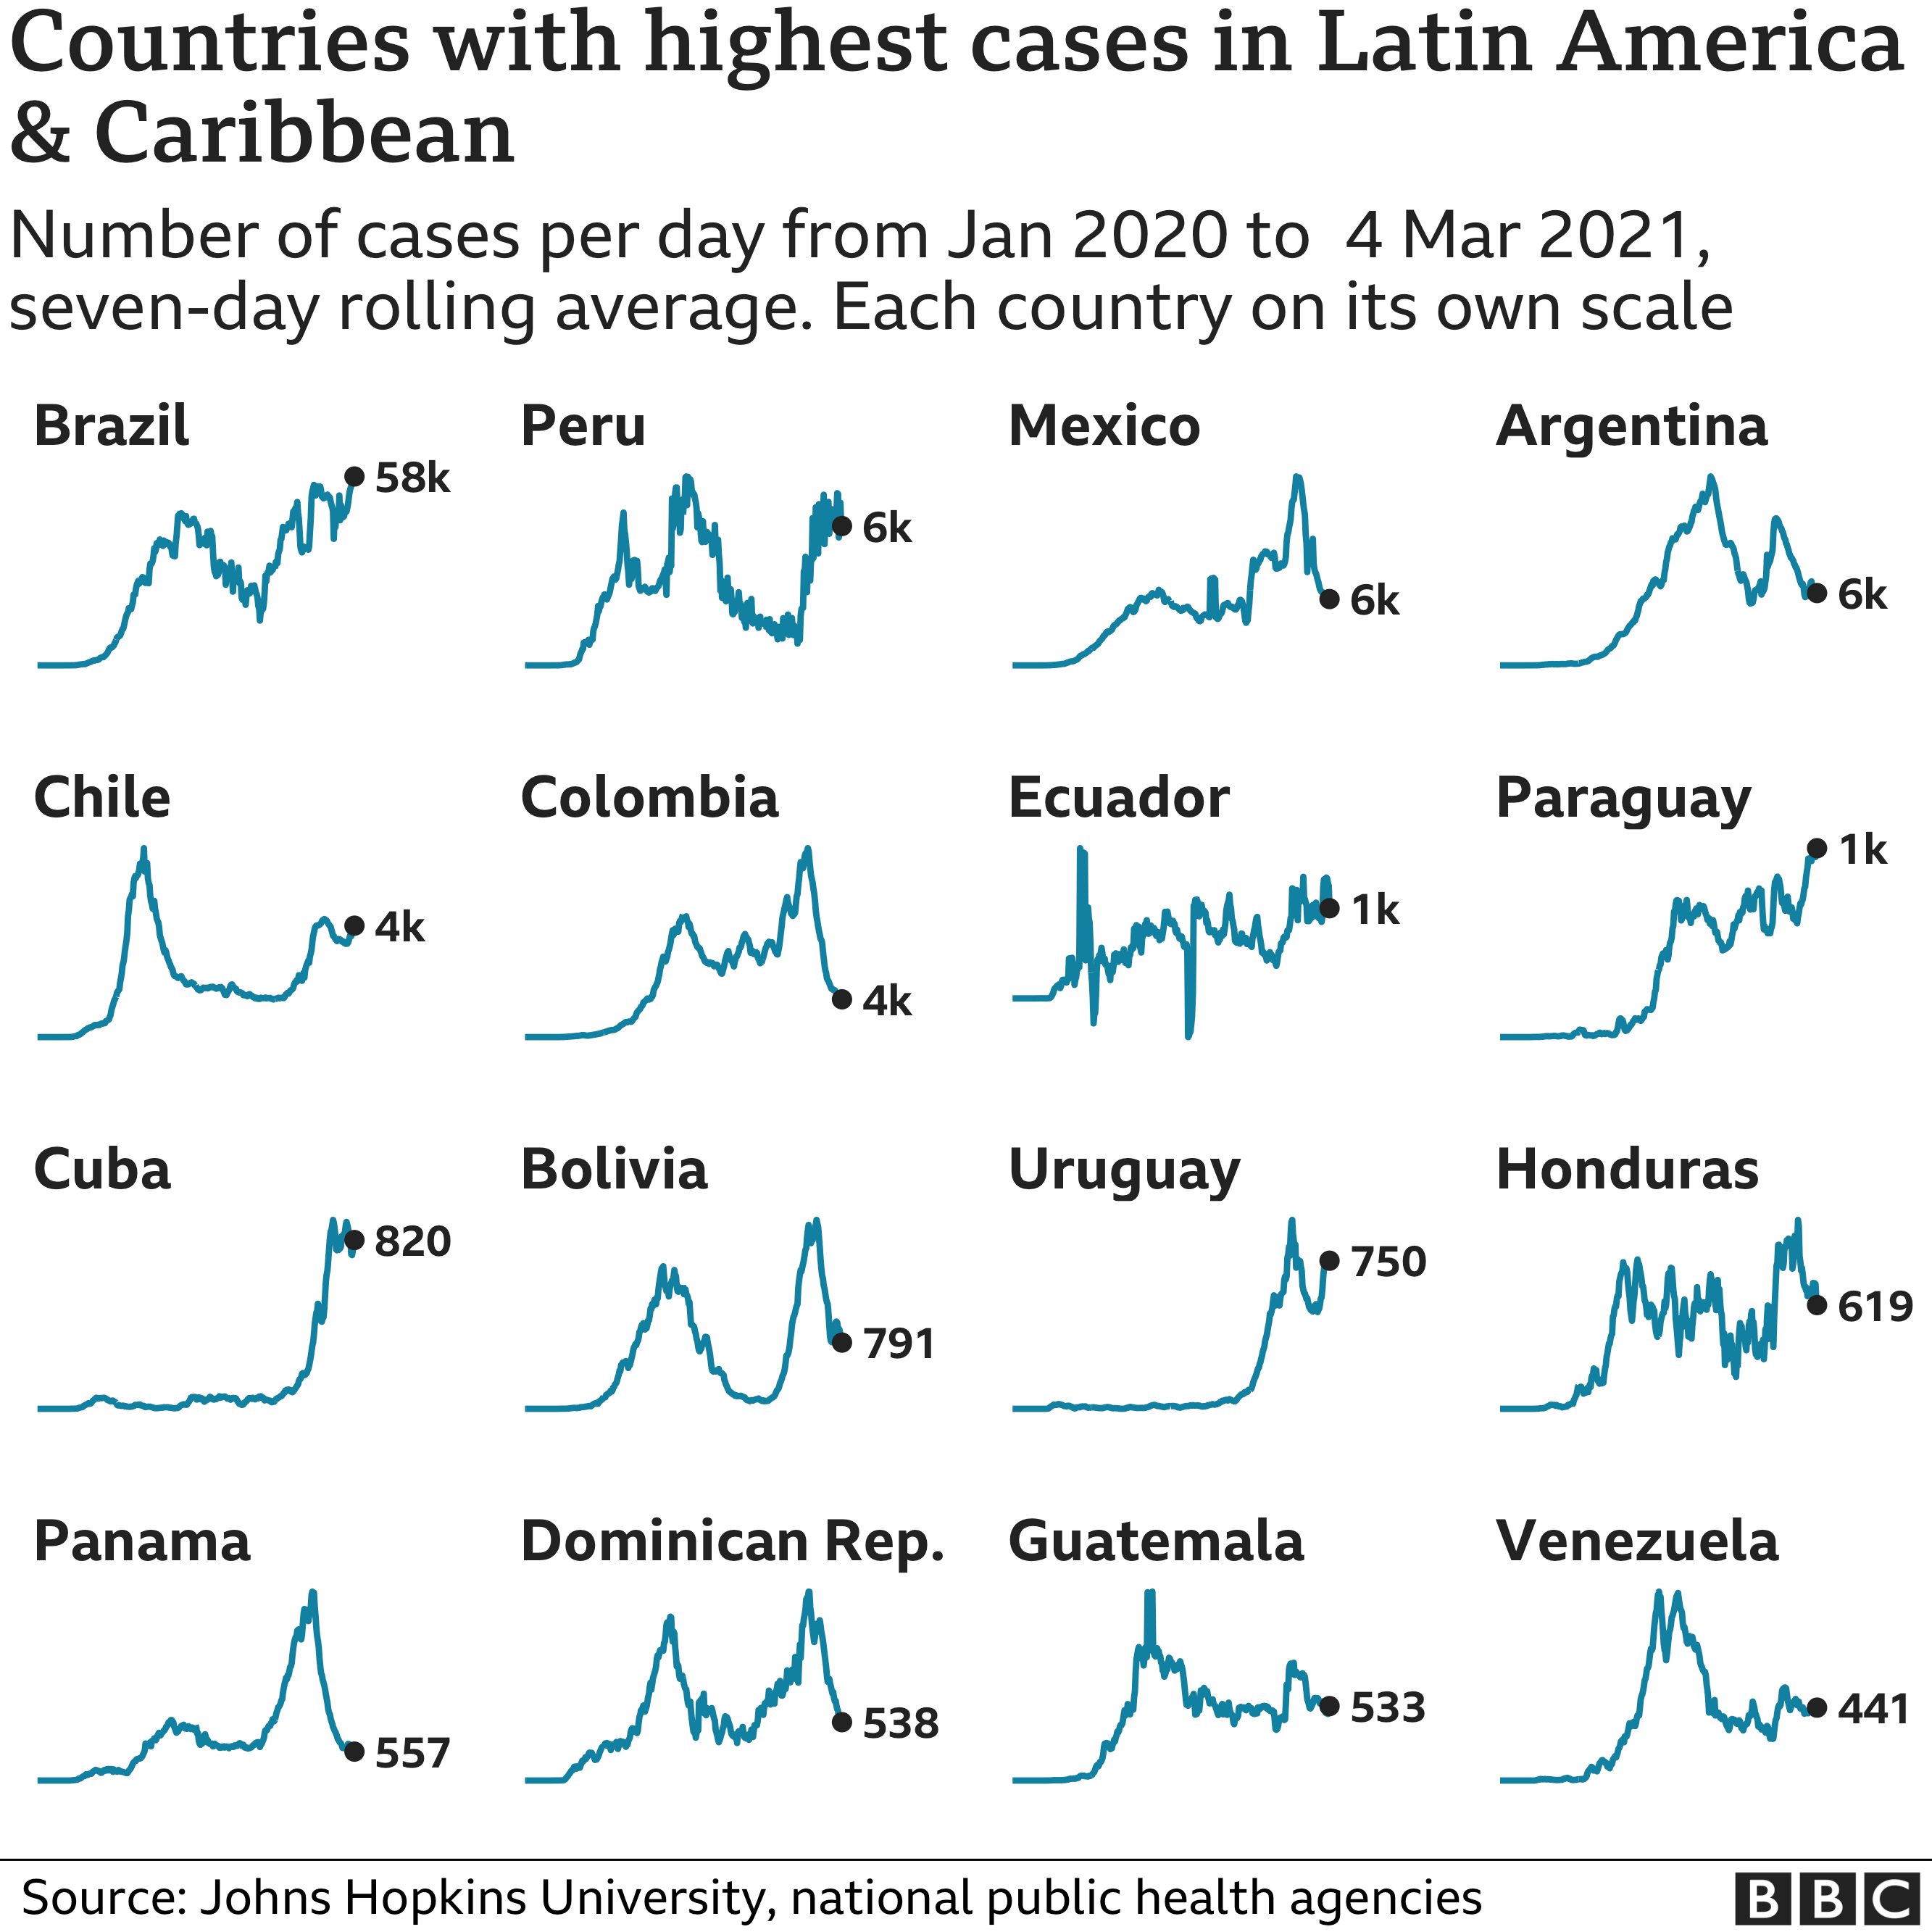
Latin America
In Latin America, there has been particular concern about a variant of the virus circulating in Brazil.
The country has nearly 11 million confirmed cases and 260,000 deaths - the world's second highest death toll.
On Thursday, Brazil's President Jair Bolsonaro urged Brazilians to "stop whining" about Covid-19, and criticised measures to curb the virus.
Argentina, Colombia and Mexico have all recorded more than two million cases while Peru has seen more than one million.
On Thursday, the UN said that more than 20 million people across Latin America and the Caribbean had been pushed into poverty during the pandemic.
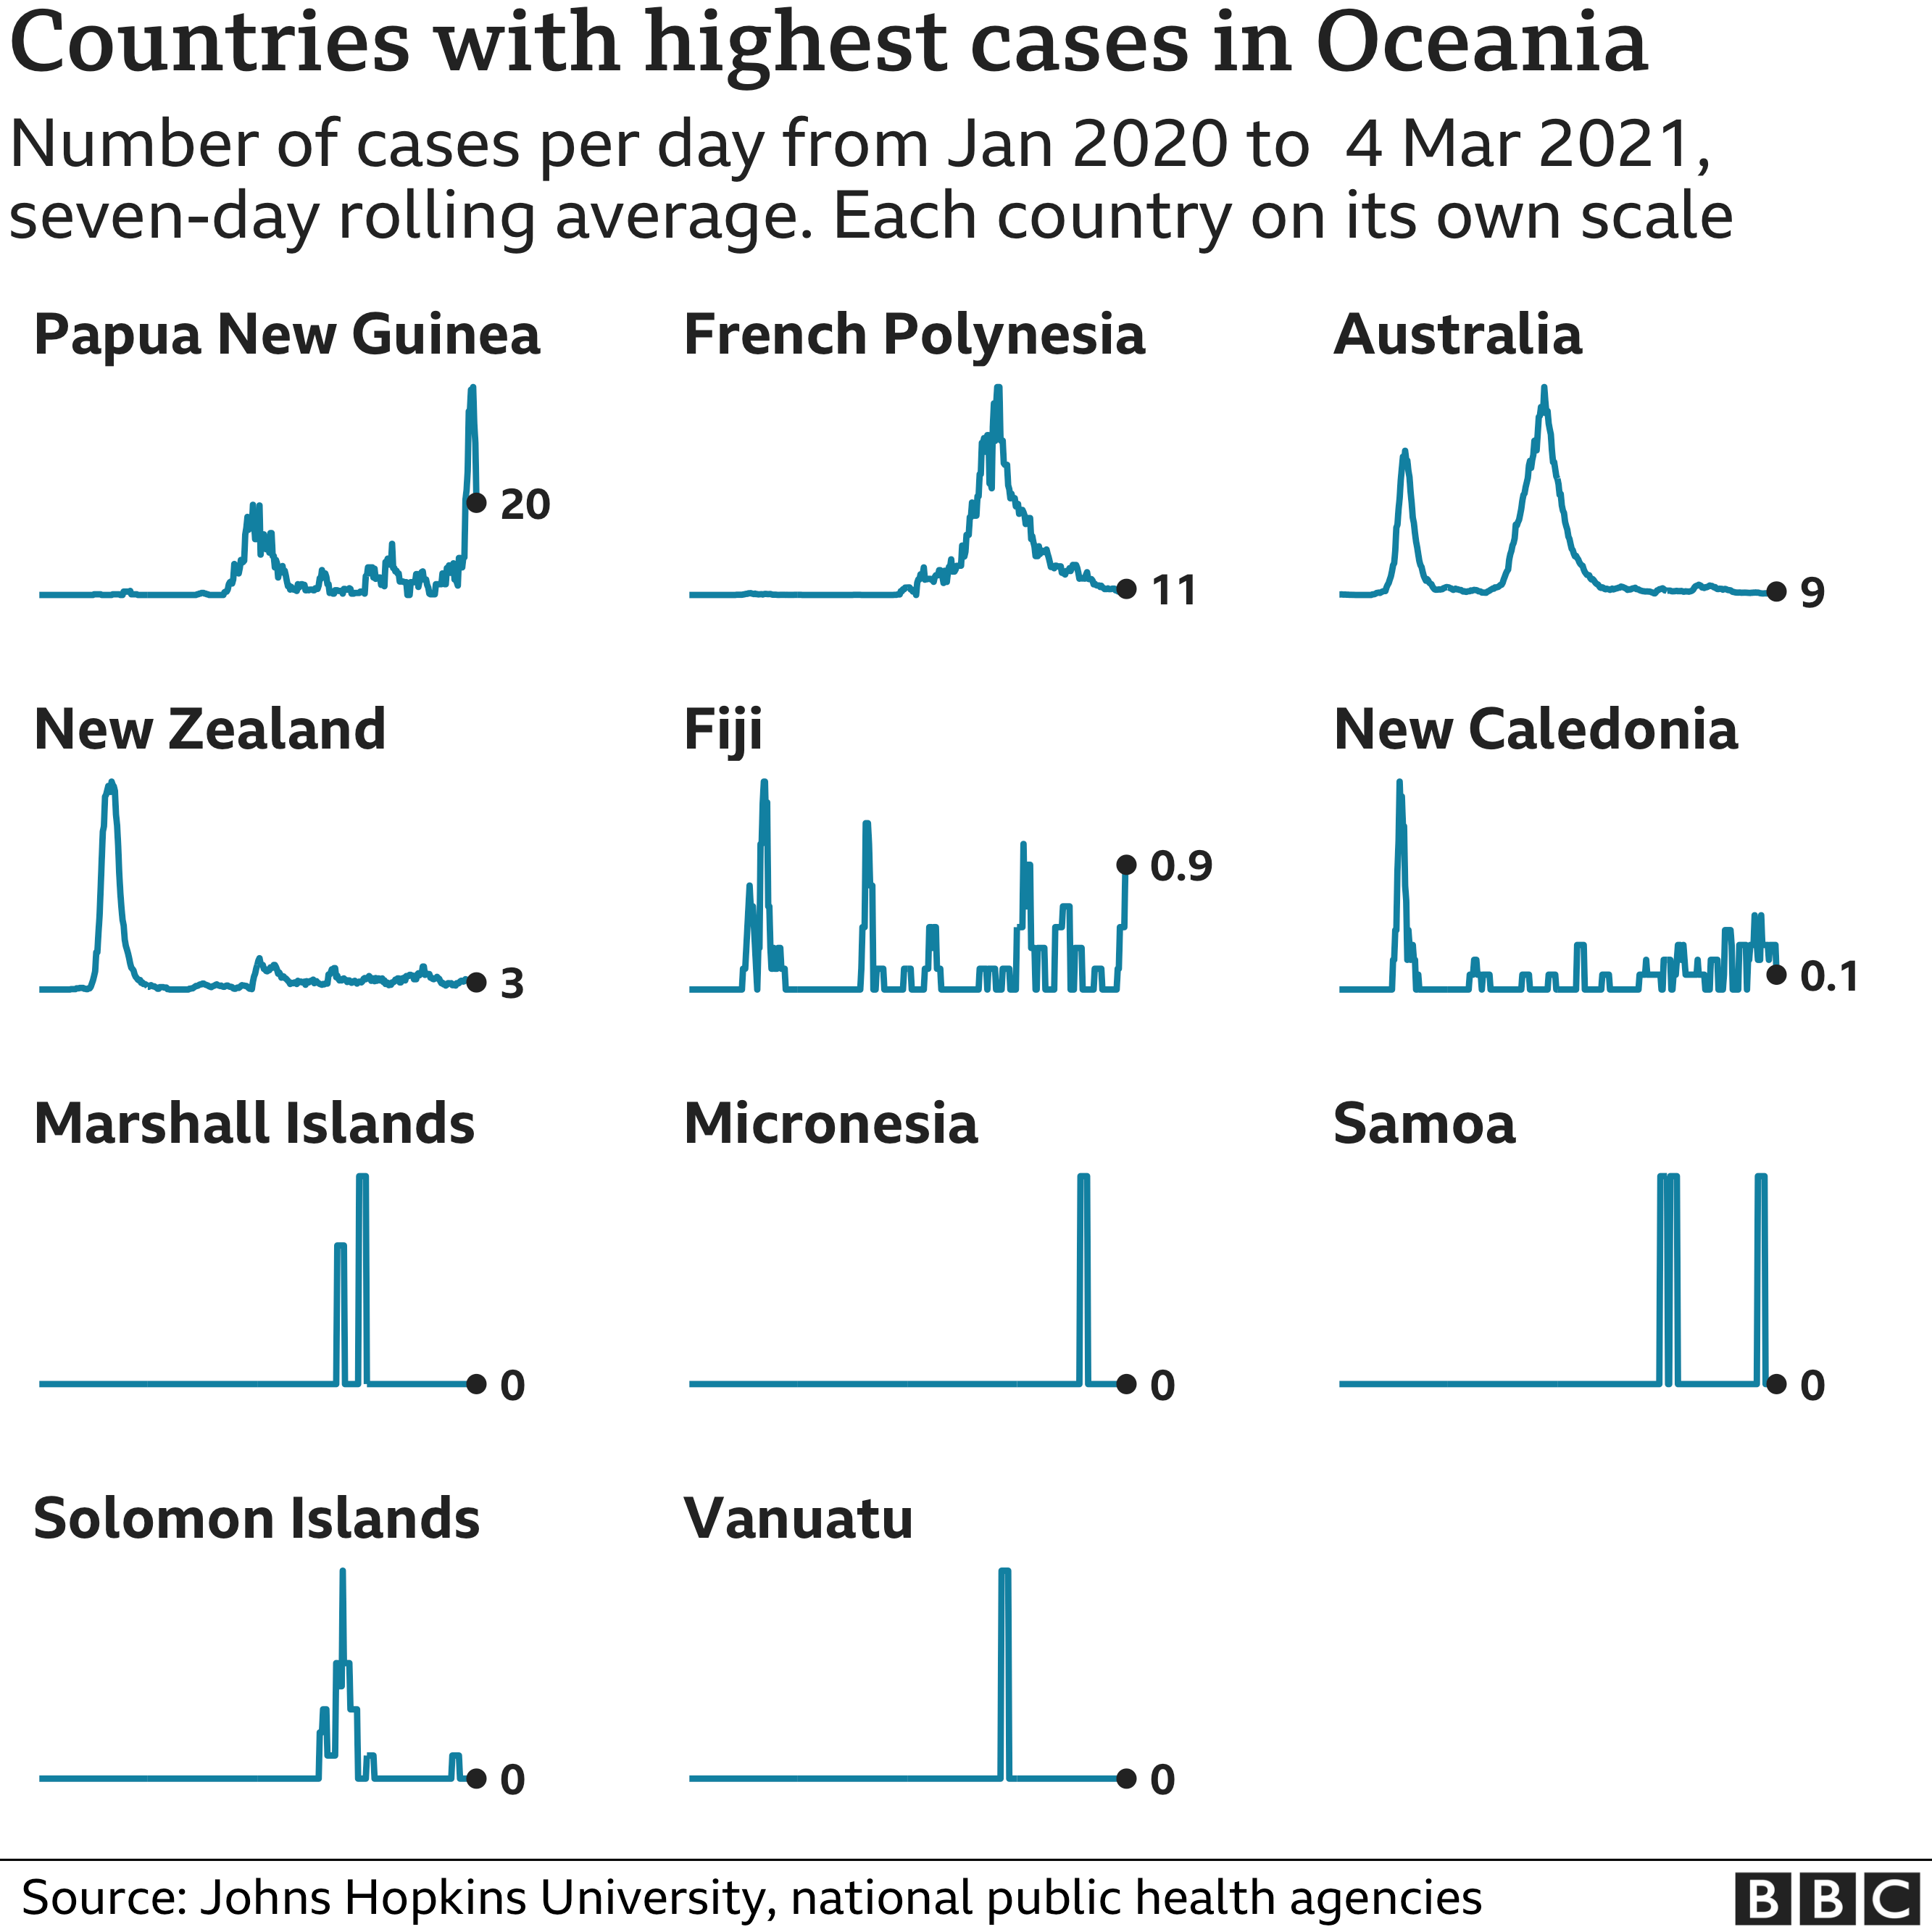
Oceania
Australia and New Zealand have been praised for their response to the pandemic, with both countries having seen comparatively few deaths.
In a sign of how effective their lockdown measures have been, both New Zealand and Australia currently have a lower average number of cases than French Polynesia, a sprawling network of islands in the Pacific Ocean.
Australia has asked the European Commission to review Italy's decision to block the export of 250,000 doses of the AstraZeneca vaccine to the country.
Most other islands in the region have seen at least a few cases.
Papua New Guinea is currently the worst-affected country in the region after seeing a recent spike in cases.
How did coronavirus spread?
Covid-19 was first detected in the city of Wuhan, China, in late 2019 but the outbreak spread quickly across the globe in the first months of 2020.
It was declared a global pandemic by the WHO on 11 March 2020.
A pandemic is when an infectious disease is passing easily from person to person in many parts of the world at the same time.

- UK LOOK-UP: How many cases in your area?
- TESTING: What tests are available?
- SYMPTOMS: What are they and how to guard against them?
- VACCINE: How do I know the Covid vaccine is safe?

About this data
The data used on this page comes from a variety of sources. It includes figures collated by Johns Hopkins University, data from the European Centre for Disease Prevention and Control, national governments and health agencies, as well as UN data on populations.
When comparing figures from different countries it is important to bear in mind that not all governments are recording coronavirus cases and deaths in the same way. This makes like for like comparisons between countries difficult.
Other factors to consider include: different population sizes, the size of a country's elderly population or whether a particular country has a large amount of its people living in densely-populated areas. In addition, countries may be in different stages of the pandemic.
No comments:
Post a Comment