Little Ice Age
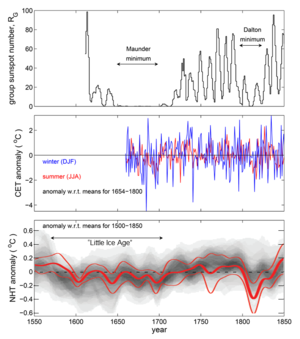
Comparison of group sunspot numbers (top), Central England Temperature
(CET) observations (middle) and reconstructions and modeling of Northern
Hemisphere Temperatures (NHT). The CET in red are summer averages (for
June, July and August) and in blue winter averages (for December of
previous year, January and February). NHT in grey is the distribution
from basket of paleoclimate reconstructions (darker grey showing higher
probability values) and in red are from model simulations that account
for solar and volcanic variations. By way of comparison, on the same
scales the anomaly for modern data (after 31 December 1999) for summer
CET is +0.65oC, for winter CET is +1.34oC, and for NHT is +1.08oC. Sunspot data are as in supplementary data to [6] and Central England Temperature data are as published by the UK Met Office [7] The NHT data are described in box TS.5, Figure 1 of the IPCC AR5 report of Working Group 1.[8]
However the Thames ceased to freeze in the 19th century largely because the removal of the "Old" (medieval) London Bridge in 1825 dramatically increased the river's flow into the Pool of London. The original 240–270-metre (800–900 ft) bridge stood upon 19 irregularly spaced arches that were set into the river bed on large starlings. It acted as a weir holding back the slack upstream waters from the tidal brackish, salt water downstream. The construction of Thames Embankment (began 1862) further increased the river's hydrological flow by narrowing the width of waterway through the centre of capital.
Note that the term "Little Ice Age" applied to the Maunder minimum is something of a misnomer as it implies a period of unremitting cold (and on a global scale), which is not the case. For example, the coldest winter in the Central England Temperature record is 1683-4, but the winter just 2 years later (both in the middle of the Maunder minimum) was the fifth warmest in the whole 350-year CET record. Furthermore, summers during the Maunder minimum were not significantly different to those seen in subsequent years. The drop in global average temperatures in paleoclimate reconstructions at the start of the Little Ice Age was between about 1560 and 1600, whereas the Maunder minimum began almost 50 years later.
end partial quote from:
https://en.wikipedia.org/wiki/Maunder_Minimum
No comments:
Post a Comment