Maunder Minimum
From Wikipedia, the free encyclopedia

The Maunder minimum in a 400-year history of sunspot numbers
The term was introduced after John A. Eddy published a landmark 1976 paper in Science.[1] Astronomers before Eddy had also named the period after the solar astronomers Annie Maunder (1868-1947) and E. Walter Maunder (1851–1928) who studied how sunspot latitudes changed with time.[2] The period the husband and wife team examined included the second half of the 17th century. Two papers were published in Edward Maunder's name in 1890 and 1894, and he cited earlier papers written by Gustav Spörer.[3] Due to the social climate of the time, Annie's contribution was not publicly recognized.[4]
Spörer noted that during one 30-year period within the Maunder Minimum observations showed fewer than 50 sunspots, as opposed to a more typical 40,000–50,000 spots in modern times.[5]
Like the Dalton Minimum and Spörer Minimum, the Maunder Minimum coincided with a period of lower-than-average European temperatures.
Contents
Sunspot observations
The Maunder Minimum occurred between 1645 and 1715 when very few sunspots were observed. This was not due to a lack of observations; during the 17th century, Giovanni Domenico Cassini carried out a systematic program of solar observations at the Observatoire de Paris, thanks to the astronomers Jean Picard and Philippe de La Hire. Johannes Hevelius also performed observations on his own. The total numbers of sunspots (but not Wolf numbers) in different years were as follows:| Year | Sunspots |
|---|---|
| 1610 | 9 |
| 1620 | 6 |
| 1630 | 9 |
| 1640 | 0 |
| 1650 | 3 |
| 1660 | Some sunspots reported by Jan Heweliusz in Machina Coelestis |
| 1670 | 0 |
| 1680 | 1 huge sunspot observed by Giovanni Domenico Cassini |
The sunspot activity was then concentrated in the southern hemisphere of the Sun, except for the last cycle when the sunspots appeared in the northern hemisphere, too.
According to Spörer's law, at the start of a cycle, spots appear at ever lower latitudes until they average at about latitude 15° at solar maximum. The average then continues to drift lower to about 7° and after that, while spots of the old cycle fade, new cycle spots start appearing again at high latitudes.
The visibility of these spots is also affected by the velocity of the sun's surface rotation at various latitudes:
| Solar latitude | Rotation period (days) |
|---|---|
| 0° | 24.7 |
| 35° | 26.7 |
| 40° | 28.0 |
| 75° | 33.0 |
Little Ice Age
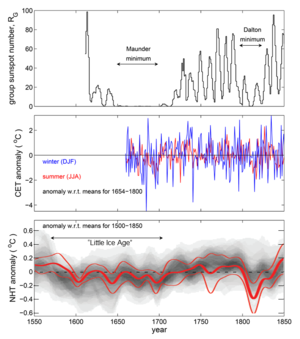
Comparison of group sunspot numbers (top), Central England Temperature
(CET) observations (middle) and reconstructions and modeling of Northern
Hemisphere Temperatures (NHT). The CET in red are summer averages (for
June, July and August) and in blue winter averages (for December of
previous year, January and February). NHT in grey is the distribution
from basket of paleoclimate reconstructions (darker grey showing higher
probability values) and in red are from model simulations that account
for solar and volcanic variations. By way of comparison, on the same
scales the anomaly for modern data (after 31 December 1999) for summer
CET is +0.65oC, for winter CET is +1.34oC, and for NHT is +1.08oC. Sunspot data are as in supplementary data to [6] and Central England Temperature data are as published by the UK Met Office [7] The NHT data are described in box TS.5, Figure 1 of the IPCC AR5 report of Working Group 1.[8]
However the Thames ceased to freeze in the 19th century largely because the removal of the "Old" (medieval) London Bridge in 1825 dramatically increased the river's flow into the Pool of London. The original 240–270-metre (800–900 ft) bridge stood upon 19 irregularly spaced arches that were set into the river bed on large starlings. It acted as a weir holding back the slack upstream waters from the tidal brackish, salt water downstream. The construction of Thames Embankment (began 1862) further increased the river's hydrological flow by narrowing the width of waterway through the centre of capital.
Note that the term "Little Ice Age" applied to the Maunder minimum is something of a misnomer as it implies a period of unremitting cold (and on a global scale), which is not the case. For example, the coldest winter in the Central England Temperature record is 1683-4, but the winter just 2 years later (both in the middle of the Maunder minimum) was the fifth warmest in the whole 350-year CET record. Furthermore, summers during the Maunder minimum were not significantly different to those seen in subsequent years. The drop in global average temperatures in paleoclimate reconstructions at the start of the Little Ice Age was between about 1560 and 1600, whereas the Maunder minimum began almost 50 years later.
Other observations

Solar activity events recorded in radiocarbon.

Graph showing proxies of solar activity, including changes in sunspot number and cosmogenic isotope production.
Past solar activity may be recorded by various proxies including carbon-14 and beryllium-10.[15] These indicate lower solar activity during the Maunder Minimum. The scale of changes resulting in the production of carbon-14 in one cycle is small (about one percent of medium abundance) and can be taken into account when radiocarbon dating is used to determine the age of archaeological artifacts. The interpretation of the beryllium-10 and carbon-14 cosmogenic isotope abundance records stored in terrestrial reservoirs such as ice sheets and tree rings has been greatly aided by reconstructions of solar and heliospheric magnetic fields based on historic data on Geomagnetic storm activity, which bridge the time gap between the end of the usable cosmogenic isotope data and the start of modern spacecraft data.[16][17]
Other historical sunspot minima have been detected either directly or by the analysis of the cosmogenic isotopes; these include the Spörer Minimum (1450–1540), and less markedly the Dalton Minimum (1790–1820). In a 2012 study, sunspot minima have been detected by analysis of carbon-14 in lake sediments.[18] In total there seem to have been 18 periods of sunspot minima in the last 8,000 years, and studies indicate that the sun currently spends up to a quarter of its time in these minima.
A paper based on an analysis of a Flamsteed drawing, suggests that the Sun's surface rotation slowed in the deep Maunder minimum (1684).[19]
During the Maunder Minimum aurorae had been observed seemingly normally, with a regular decadal-scale cycle.[20][21] This is somewhat surprising because the later, and less deep, Dalton sunspot minimum is clearly seen in auroral occurrence frequency, at least at lower geomagnetic latitudes.[22] Because geomagnetic latitude is an important factor in auroral occurrence, (lower-latitude aurorae requiring higher levels of solar-terrestrial activity) it becomes important to allow for population migration and other factors that may have influenced the number of reliable auroral observers at a given magnetic latitude for the earlier dates.[23] Decadal-scale cycles during the Maunder minimum can also be seen in the abundances of the beryllium-10 cosmogenic isotope (which unlike carbon-14 can be studied with annual resolution) [24] but these appear to be in antiphase with any remnant sunspot activity. An explanation in terms of solar cycles in loss of solar magnetic flux was proposed in 2012.[25]
The fundamental papers on the Maunder minimum (Eddy, Legrand, Gleissberg, Schröder, Landsberg et al.) have been published in Case studies on the Spörer, Maunder and Dalton Minima.[26]
See also
References
- Schröder, Wilfried (2005). Case studies on the Spörer, Maunder, and Dalton minima. Beiträge zur Geschichte der Geophysik und Kosmischen Physik 6. Potsdam: AKGGP, Science Edition.
Further reading
- Luterbach, J. et al. (2001). "The Late Maunder Minimum (1675-1715) - A Key Period for Studying Decadal Scale Climatic Change in Europe". Climatic Change 49 (4): 441–462. doi:10.1023/A:1010667524422.
- Soon, Willie Wei-Hock; Yaskell, Steven H. (2003). The Maunder Minimum and the Variable Sun-Earth Connection. River Edge, NJ: World Scientific. ISBN 981-238-275-5.
- What's wrong with the sun? (Nothing)
- Solar poles to become quadrupolar in May 2012 (Hinode)
- Barnard, L. et al. (2011). "Predicting Space Climate Change". Geophys. Res. Lett 38 (16): L16103. Bibcode:2011GeoRL..3816103B. doi:10.1029/2011GL048489.
External links
- HistoricalClimatology.com, further links and resources, updated 2014
- Climate History Network, network of historical climatologists, updated 2014
|
|||||||||||||||||||||||||||||||||||||||

- E.W.M. (1890) "Professor Spoerer's researches on sun-spots," Monthly Notices of the Royal Astronomical Society, 50 : 251-252.
- E. Walter Maunder (August 1, 1894) "A prolonged sunspot minimum," Knowledge, 17 : 173-176.
- Spörer (1887) "Ueber die Periodicität der Sonnenflecken seit dem Jahre 1618, vornehmlich in Bezug auf die heliographische Breite derselben, und Hinweis auf eine erhebliche Störung dieser Periodicität während eines langen Zeitraumes" (On the periodicity of sunspots since the year 1618, especially with respect to the heliographic latitude of the same, and reference to a significant disturbance of this periodicity during a long period), Vierteljahrsschrift der Astronomischen Gesellschaft (Leipzig), 22 : 323-329.
- G. Spoerer (February 1889) "Sur les différences que présentent l'hémisphère nord et l'hémisphère sud du Soleil" (On the differences that the northern hemisphere and southern hemisphere of the sun present), Bulletin Astronomique, 6 : 60-63.
No comments:
Post a Comment