My wife told me that the number one cause of death in Wyoming as suicide which surprised me, because I would think that the number 1 cause of death in places like Seattle or Alaska would be suicide too. However, I was wrong about Washington and right about Alaska where the number 1 cause of death is also suicide. I think there is just so much loneliness and remoteness that people actually put up with before they kill themselves even though they might like the remoteness, eventually they need to be around more people. I found this to be true in myself when I lived very remotely with my family in mt. Shasta area 10 miles from the nearest Gas station or services and without electricity in a house I built for my family then around 1980. So, even though I was despondent on many levels to return to the San Francisco Bay area it was likely the best choice for myself and my family because the kids all went to college and some got degrees and all were successful and now married in their 30s to their 50s.
The number 1 cause of death in Seattle and Washington is pneumonia which isn't that surprising because my female cousins husband died of this in Seattle when he was only 60 years old.
begin quote from:
https://www.effortlessinsurance.com/most-common-cause-of-death-all-states/
The Most Surprising (Yet) Common Causes of Death [All 50 States + DC]
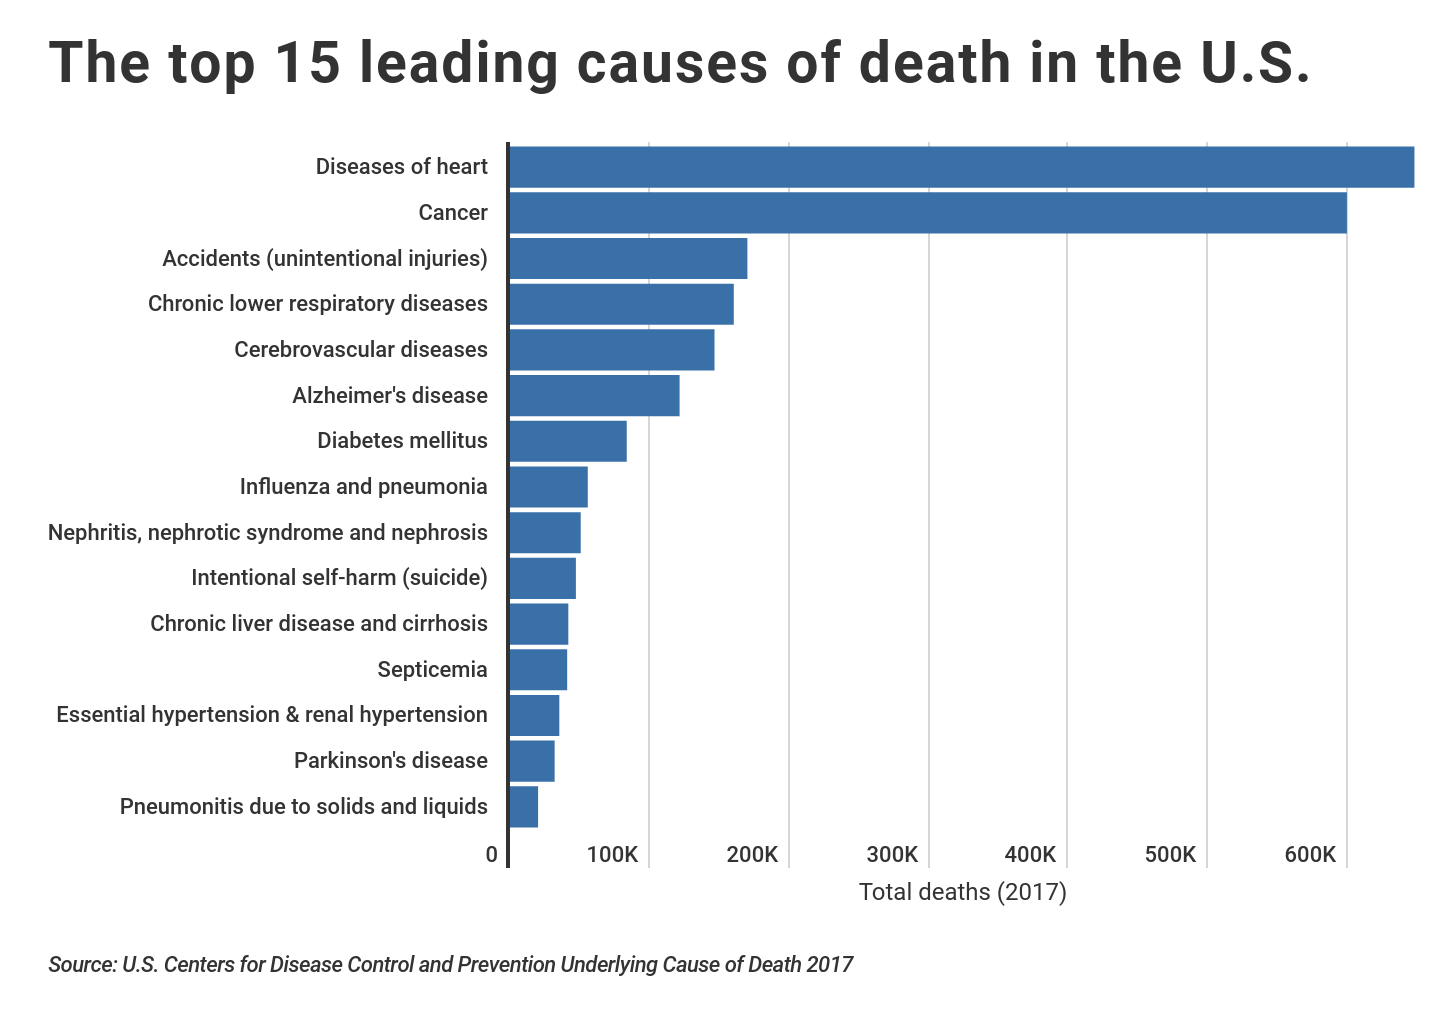
Heart diseases were the leader in the most common causes of death in 2017, with over 600,000 people killed. Cancer was the second-leading common cause of death in 2017, with roughly 600,000 people killed. Age-adjusted deaths were lower in the Southeast, meaning people in that region are dying younger than in other states.
Free Car Insurance Comparison
Compare Quotes From Top Companies and Save
Secured with SHA-256 Encryption
On This Page
Advances in medicine and technology have led to decades of rising life expectancy in the U.S. However, according to the Centers for Disease Control and Prevention, life expectancy at birth in the U.S. was 78.6 years in 2017, down from 78.7 years in 2016.
What are the most common causes of death for each state and D.C. in America? This article aims to answer this question.
Though it may seem small, this notable decline marks the third consecutive year that life expectancy at birth has fallen and represents an alarming national trend.
While common physical health conditions like heart disease and cancer still claim the majority of lives in the U.S. each year and is one of the most common causes of death in elderly people, accidental deaths from overdoses and intentional deaths by suicide are largely responsible for rising mortality rates nationwide.
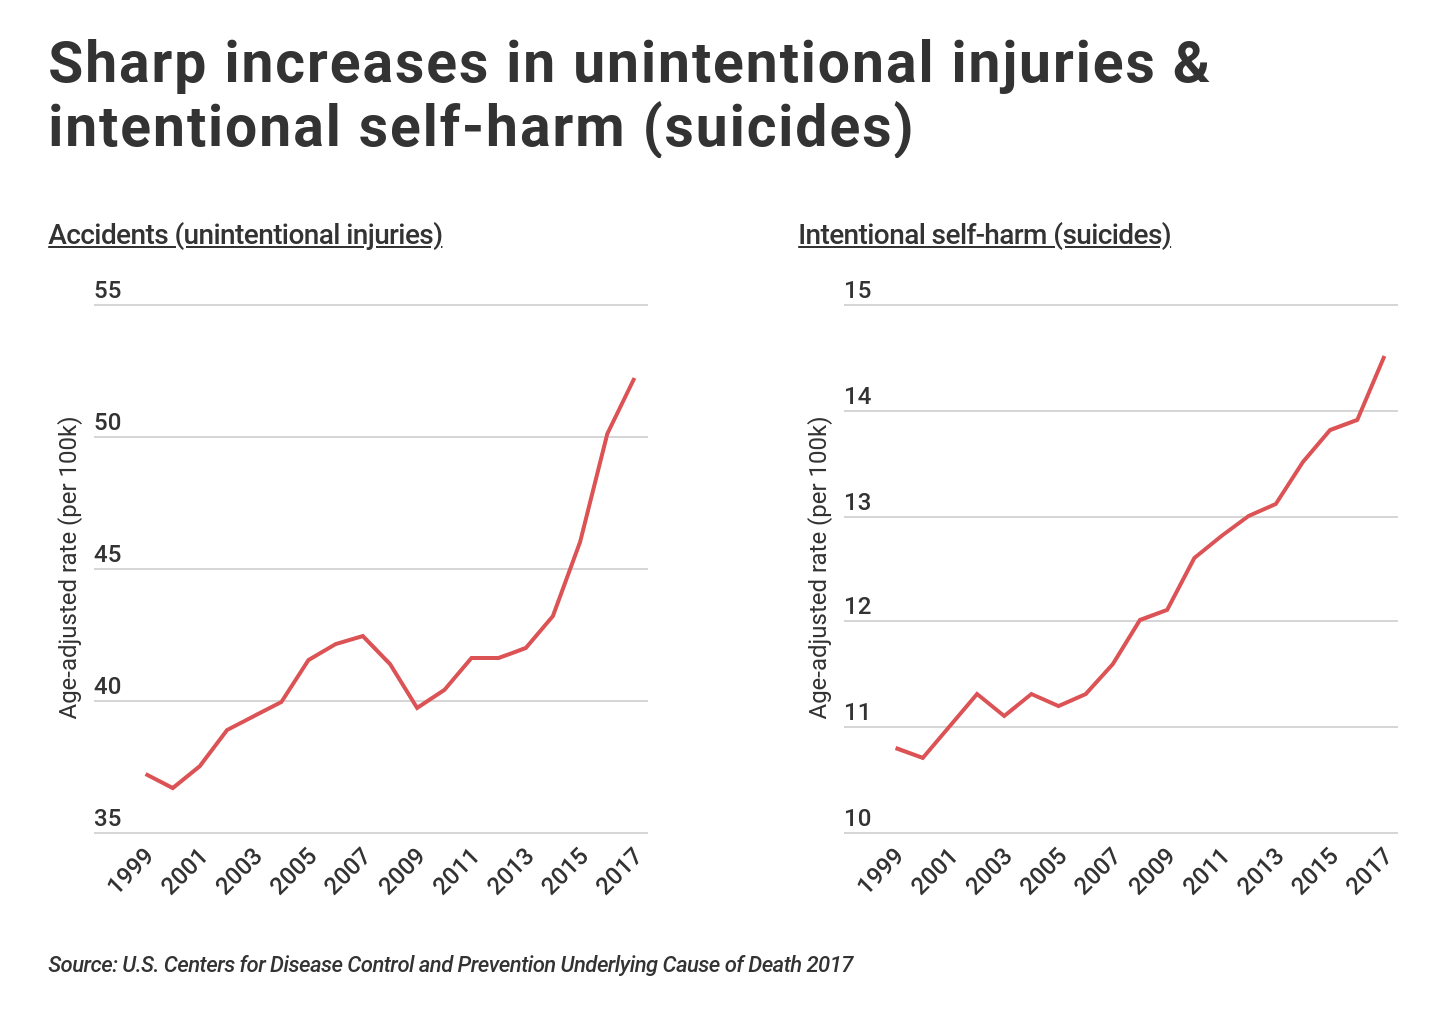
Despite representing a smaller percentage of total deaths compared to other major health conditions, death rates due to suicide and accidents have skyrocketed over the past two decades.
In 2017, the suicide death rate per 100,000 people was 14.5, an increase of 33 percent from the rate of 10.8 in 1999. Over the same time period, the death rate due to accidents increased from 37.2 per 100,000 to 52.2. Accidents are defined as unintentional injuries, which include alcohol and drug overdoses.
According to the CDC, 70,327 deaths in 2017 were the result of drug overdoses, with about two-thirds related to opioids. This represents a 9.6 percent increase in the age-adjusted death rate from 2016.
The states with the highest rates of drug overdose deaths are West Virginia (57.8 per 100,000), Ohio (46.3 per 100,000), Pennsylvania (44.3 per 100,000), the District of Columbia (44.0 per 100,000), and Kentucky (37.2 per 100,000).
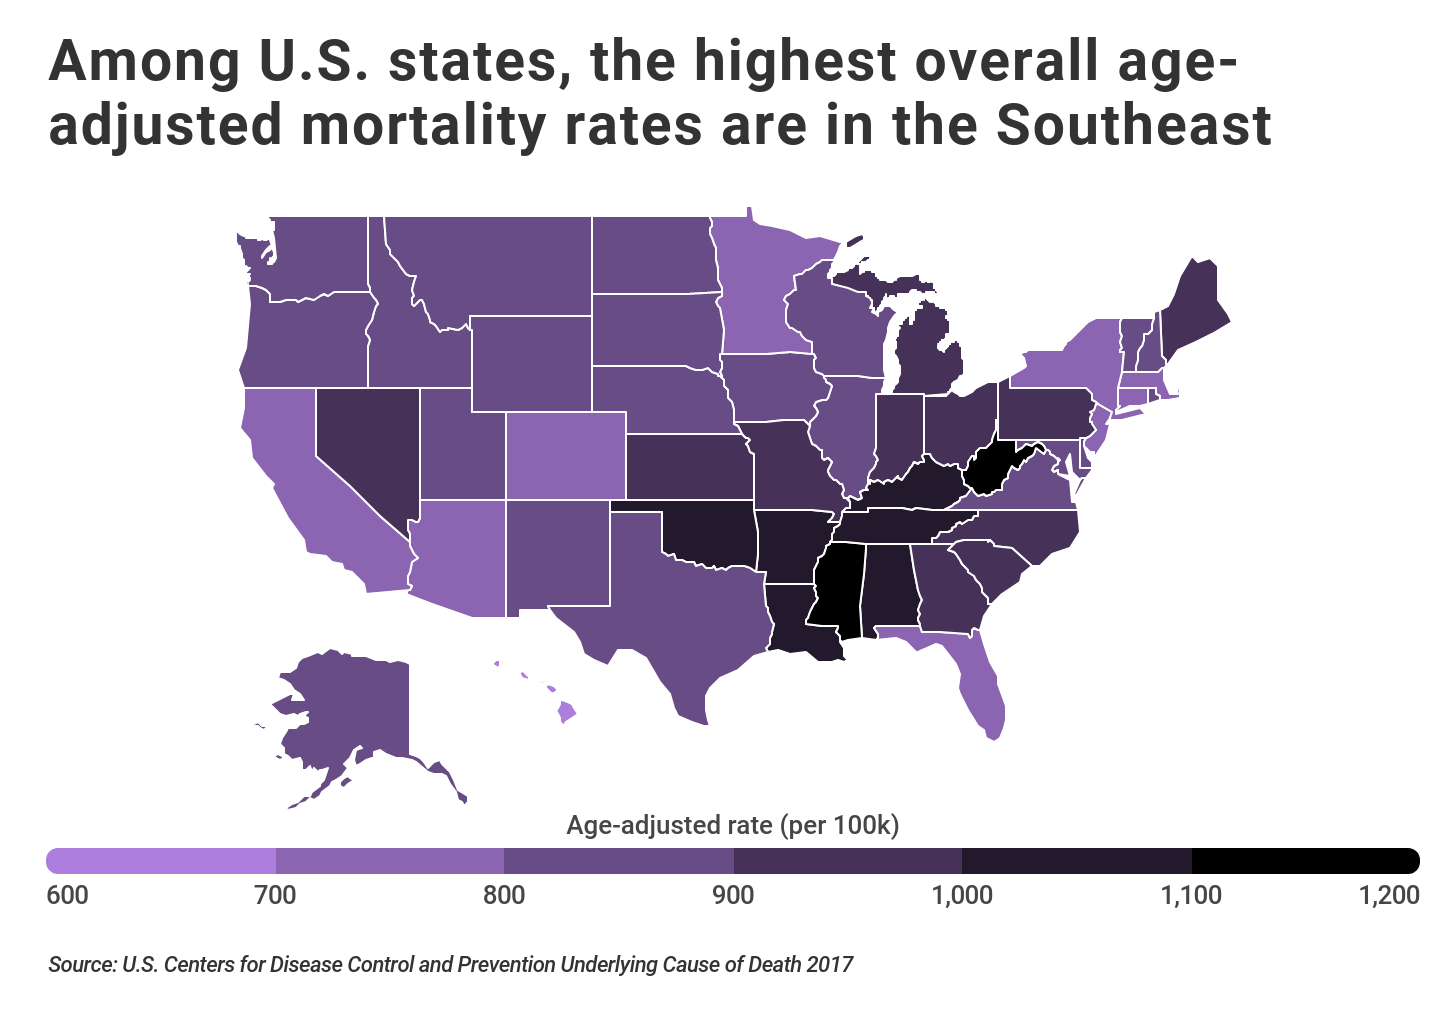
Overall, mortality rates also vary significantly by state. There is a clear geographical cluster of high mortality rates for states along the Ohio and Mississippi Rivers. More specifically, eight states in the Southeast, including West Virginia, Mississippi, Alabama, and Tennessee have age-adjusted mortality rates exceeding 1,000 per 100,000 people. By contrast, the lowest mortality rates are in California and Hawaii at 734.1 and 688.2 respectively.
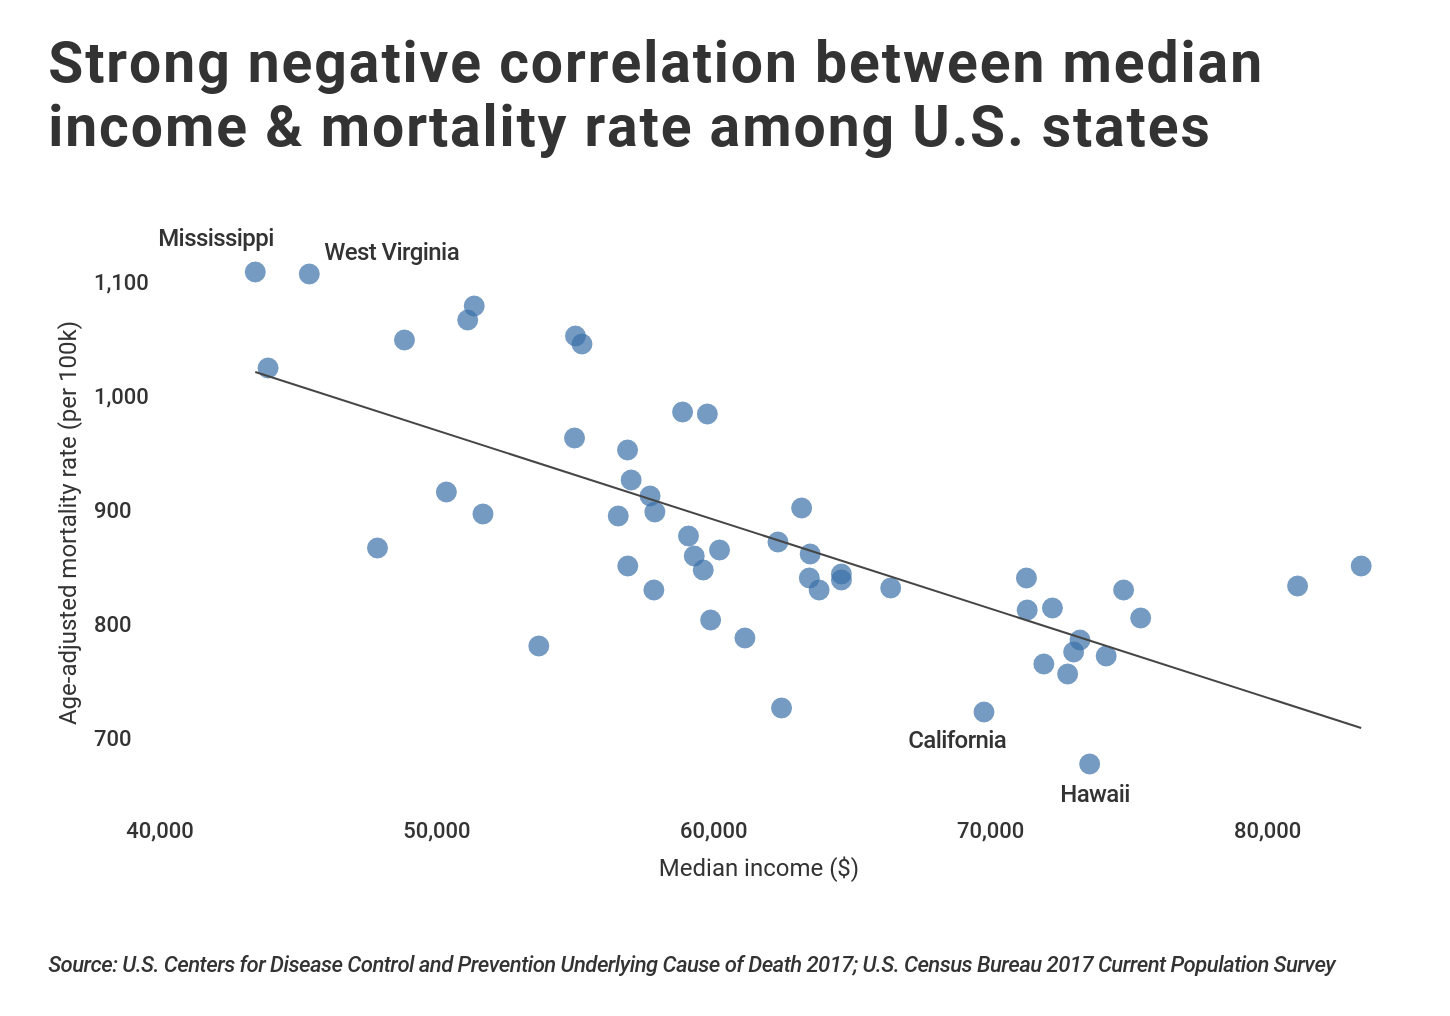
There is a significant relationship between high mortality rates and low median incomes among U.S. states. For example, Mississippi, Louisiana, Arkansas, and West Virginia have median household incomes below $50,000 as well as mortality rates in excess of 1,000 per 100,000. California and Hawaii, which have median household incomes around $70,000, have mortality rates under 750 per 100,000.
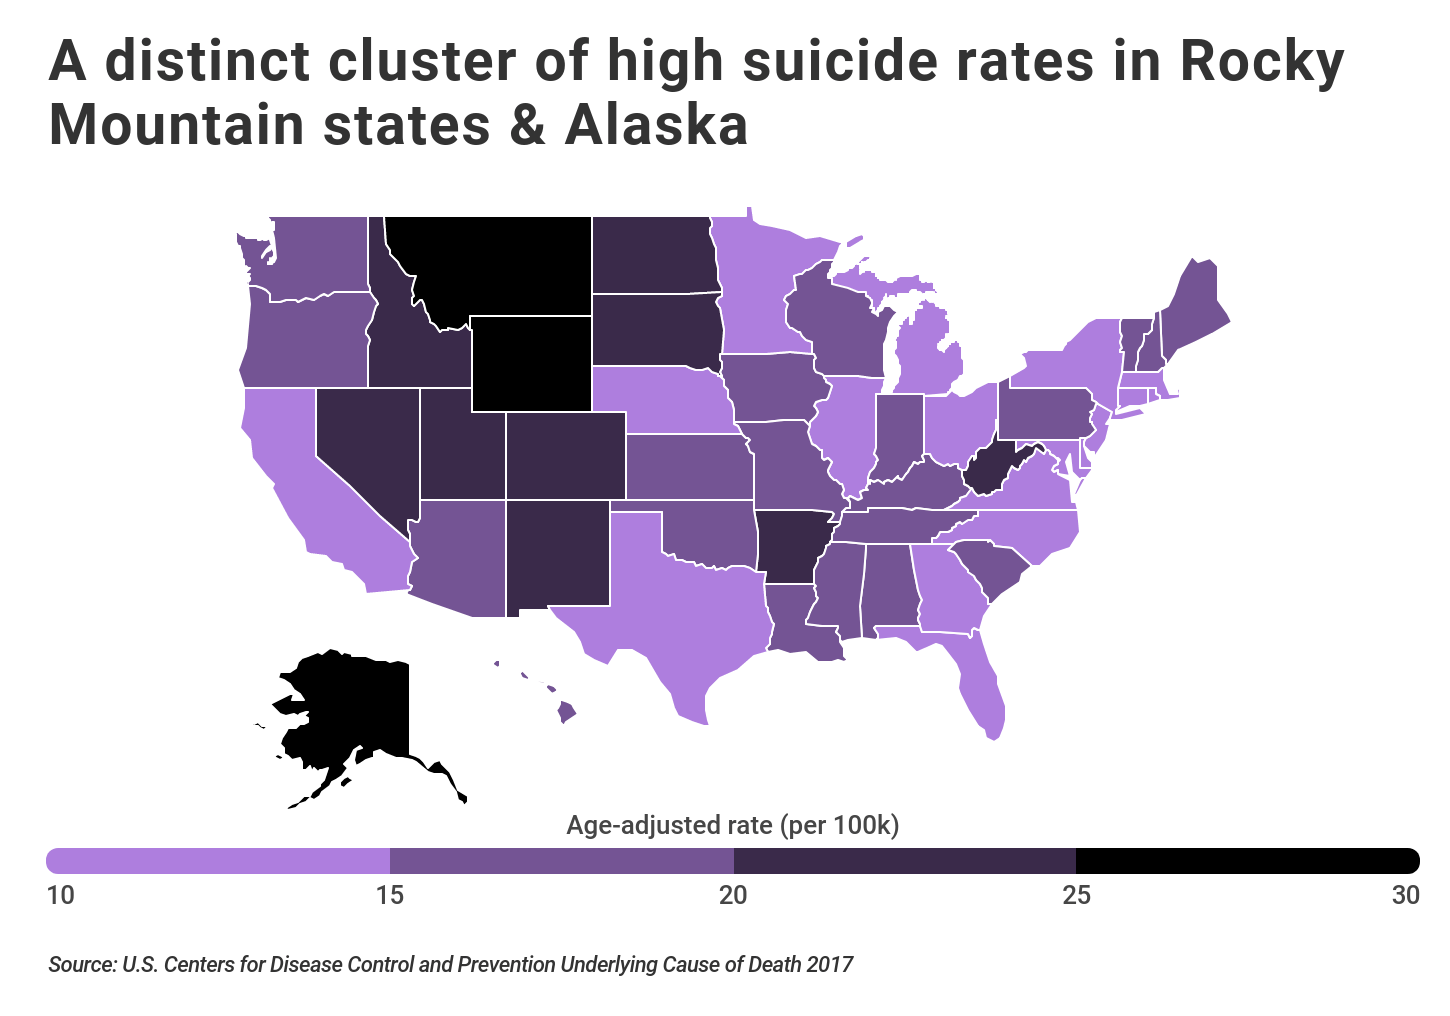
The other major geographic trend related to mortality rates is a clear cluster of high suicide rates in Alaska and the Rocky Mountain region, which has been labeled “the suicide belt.” In 2017, the suicide rate was highest in Montana, at a rate of 29.7 deaths per 100,000 people, and lowest in Washington D.C., at 6.7 deaths per 100,000.
TRENDING
Thinking about getting a life insurance policy? We know it can
be confusing so we have created a life insurance frequently asked
questions page that covers 50 questions about life insurance. You can
also visit our life insurance articles page for in-depth reviews of life
insurance companies.
In general, suicide rates are significantly lower on the East Coast and in California. Research from the CDC shows that suicide is particularly prevalent among young people and became the second-leading cause of death for Americans aged 10-34 in 2016.
The same CDC report indicates that in 2017, the suicide rate in rural counties was 1.8 times higher than the suicide rate in urban counties, a differential that had also increased since 1999.
To find out how major causes of death vary around the country, our researchers calculated the most surprising cause of death in each state, using 2017 data from the CDC WONDER Online Database. For the top 15 leading causes of death nationally, we compared each state’s age-adjusted mortality rate to the national mortality rate for that cause.
Whichever cause exceeded its respective national mortality rate by the greatest amount, was identified as the most over-indexed cause of death in that state.
The most over-indexed cause of death represents a disproportionately high death rate within the state relative to the national rate. In this article, we’ll cover the following topics, some of which in the main parts of the article and others in the frequently asked questions section:
- Leading causes of death by state
- Leading cause of death in the US in 2018
- Death statistics by cause
- US death statistics in 2019
Before we get to the state-by-state analysis, are you ready to jump in and get a life insurance quote right away? Our online quote generator will give you the best quote based on where you live and your demographic information. Just enter your ZIP code into the box above to get started.
Now, let’s get to that state-by-state analysis.
The Most Surprising Common Cause of Death in Every State
#1 – Alabama
- Most over-indexed cause of death: Septicemia
- State age-adjusted death rate for the cause: 20.8 deaths per 100,000 people
- State total number of deaths per year for the cause: 1,036
- State percentage of total deaths for the cause: 1.95%
#2 – Alaska
- Most over-indexed cause of death: Intentional self-harm (suicide)
- State age-adjusted death rate for the cause: 27.5 deaths per 100,000 people
- State total number of deaths per year for the cause: 200
- State percentage of total deaths for the cause: 4.53%
#3 – Arizona
- Most over-indexed cause of death: Intentional self-harm (suicide)
- State age-adjusted death rate for the cause: 19.1 deaths per 100,000 people
- State total number of deaths per year for the cause: 1,327
- State percentage of total deaths for the cause: 2.30%
#4 – Arkansas
- Most over-indexed cause of death: Chronic lower respiratory diseases
- State age-adjusted death rate for the cause: 80.6 deaths per 100,000 people
- State total number of deaths per year for the cause: 2,517
- State percentage of total deaths for the cause: 7.72%
#5 – California
- Most over-indexed cause of death: Essential hypertension and hypertensive renal disease
- State age-adjusted death rate for the cause: 15.4 deaths per 100,000 people
- State total number of deaths per year for the cause: 5,596
- State percentage of total deaths for the cause: 2.09%
#6 – Colorado
- Most over-indexed cause of death: Intentional self-harm (suicide)
- State age-adjusted death rate for the cause: 21 deaths per 100,000 people
- State total number of deaths per year for the cause: 1,181
- State percentage of total deaths for the cause: 3.10%
#7 – Connecticut
- Most over-indexed cause of death: Pneumonitis due to solids and liquids
- State age-adjusted death rate for the cause: 9.2 deaths per 100,000 people
- State total number of deaths per year for the cause: 392
- State percentage of total deaths for the cause: 1.25%
#8 – Delaware
- Most over-indexed cause of death: Nephritis, nephrotic syndrome and nephrosis
- State age-adjusted death rate for the cause: 19.5 deaths per 100,000 people
- State total number of deaths per year for the cause: 205
- State percentage of total deaths for the cause: 2.23%
#9 – District of Columbia
- Most over-indexed cause of death: Accidents (unintentional injuries)
- State age-adjusted death rate for the cause: 70.2 deaths per 100,000 people
- State total number of deaths per year for the cause: 427
- State percentage of total deaths for the cause: 8.60%
#10 – Florida
- Most over-indexed cause of death: Accidents (unintentional injuries)
- State age-adjusted death rate for the cause: 58.4 deaths per 100,000 people
- State total number of deaths per year for the cause: 13,059
- State percentage of total deaths for the cause: 6.41%
#11 – Georgia
- Most over-indexed cause of death: Septicemia
- State age-adjusted death rate for the cause: 18.1 deaths per 100,000 people
- State total number of deaths per year for the cause: 1,611
- State percentage of total deaths for the cause: 1.94%
#12 – Hawaii
- Most over-indexed cause of death: Influenza and pneumonia
- State age-adjusted death rate for the cause: 35.8 deaths per 100,000 people
- State total number of deaths per year for the cause: 637
- State percentage of total deaths for the cause: 5.59%
#13 – Idaho
- Most over-indexed cause of death: Intentional self-harm (suicide)
- State age-adjusted death rate for the cause: 23.7 deaths per 100,000 people
- State total number of deaths per year for the cause: 392
- State percentage of total deaths for the cause: 2.80%
#14 – Illinois
- Most over-indexed cause of death: Nephritis, nephrotic syndrome and nephrosis
- State age-adjusted death rate for the cause: 20 deaths per 100,000 people
- State total number of deaths per year for the cause: 2,565
- State percentage of total deaths for the cause: 2.34%
#15 – Indiana
- Most over-indexed cause of death: Septicemia
- State age-adjusted death rate for the cause: 19.4 deaths per 100,000 people
- State total number of deaths per year for the cause: 1,277
- State percentage of total deaths for the cause: 1.95%
#16 – Iowa
- Most over-indexed cause of death: Chronic lower respiratory diseases
- State age-adjusted death rate for the cause: 55.7 deaths per 100,000 people
- State total number of deaths per year for the cause: 1,939
- State percentage of total deaths for the cause: 6.35%
#17 – Kansas
- Most over-indexed cause of death: Intentional self-harm (suicide)
- State age-adjusted death rate for the cause: 19.4 deaths per 100,000 people
- State total number of deaths per year for the cause: 553
- State percentage of total deaths for the cause: 2.04%
#18 – Kentucky
- Most over-indexed cause of death: Septicemia
- State age-adjusted death rate for the cause: 22 deaths per 100,000 people
- State total number of deaths per year for the cause: 979
- State percentage of total deaths for the cause: 2.03%
DID YOU KNOW?
The life insurance attending physician statement isn’t always
a requirement when getting life insurance; however, it’s often a major
factor in issuing and pricing the policy. Learn more in our no exam life
insurance guide.
#19 – Louisiana
- Most over-indexed cause of death: Septicemia
- State age-adjusted death rate for the cause: 24.4 deaths per 100,000 people
- State total number of deaths per year for the cause: 1,080
- State percentage of total deaths for the cause: 2.36%
#20 – Maine
- Most over-indexed cause of death: Intentional self-harm (suicide)
- State age-adjusted death rate for the cause: 19.5 deaths per 100,000 people
- State total number of deaths per year for the cause: 274
- State percentage of total deaths for the cause: 1.87%
#21 – Maryland
- Most over-indexed cause of death: Septicemia
- State age-adjusted death rate for the cause: 14.9 deaths per 100,000 people
- State total number of deaths per year for the cause: 882
- State percentage of total deaths for the cause: 1.77%
#22 – Massachusetts
- Most over-indexed cause of death: Pneumonitis due to solids and liquids
- State age-adjusted death rate for the cause: 7.7 deaths per 100,000 people
- State total number of deaths per year for the cause: 581
- State percentage of total deaths for the cause: 0.99%
#23 – Michigan
- Most over-indexed cause of death: Diseases of heart
- State age-adjusted death rate for the cause: 236.5 deaths per 100,000 people
- State total number of deaths per year for the cause: 25,187
- State percentage of total deaths for the cause: 25.81%
#24 – Minnesota
- Most over-indexed cause of death: Intentional self-harm (suicide)
- State age-adjusted death rate for the cause: 14.2 deaths per 100,000 people
- State total number of deaths per year for the cause: 783
- State percentage of total deaths for the cause: 1.76%
Free Life Insurance Comparison
Compare Quotes From Top Companies and Save
Secured with SHA-256 Encryption
#25 – Mississippi
- Most over-indexed cause of death: Essential hypertension and hypertensive renal disease
- State age-adjusted death rate for the cause: 19.2 deaths per 100,000 people
- State total number of deaths per year for the cause: 551
- State percentage of total deaths for the cause: 1.71%
#26 – Missouri
- Most over-indexed cause of death: Nephritis, nephrotic syndrome and nephrosis
- State age-adjusted death rate for the cause: 23.5 deaths per 100,000 people
- State total number of deaths per year for the cause: 1,515
- State percentage of total deaths for the cause: 2.45%
#27 – Montana
- Most over-indexed cause of death: Intentional self-harm (suicide)
- State age-adjusted death rate for the cause: 29.7 deaths per 100,000 people
- State total number of deaths per year for the cause: 311
- State percentage of total deaths for the cause: 3.05%
#28 – Nebraska
- Most over-indexed cause of death: Chronic lower respiratory diseases
- State age-adjusted death rate for the cause: 62.9 deaths per 100,000 people
- State total number of deaths per year for the cause: 1,224
- State percentage of total deaths for the cause: 7.25%
#29 – Nevada
- Most over-indexed cause of death: Intentional self-harm (suicide)
- State age-adjusted death rate for the cause: 21.2 deaths per 100,000 people
- State total number of deaths per year for the cause: 627
- State percentage of total deaths for the cause: 2.54%
#30 – New Hampshire
- Most over-indexed cause of death: Intentional self-harm (suicide)
- State age-adjusted death rate for the cause: 19.2 deaths per 100,000 people
- State total number of deaths per year for the cause: 265
- State percentage of total deaths for the cause: 2.12%
#31 – New Jersey
- Most over-indexed cause of death: Septicemia
- State age-adjusted death rate for the cause: 20 deaths per 100,000 people
- State total number of deaths per year for the cause: 1,898
- State percentage of total deaths for the cause: 2.54%
#32 – New Mexico
- Most over-indexed cause of death: Chronic liver disease and cirrhosis
- State age-adjusted death rate for the cause: 29.3 deaths per 100,000 people
- State total number of deaths per year for the cause: 605
- State percentage of total deaths for the cause: 3.24%
#33 – New York
- Most over-indexed cause of death: Influenza and pneumonia
- State age-adjusted death rate for the cause: 21.1 deaths per 100,000 people
- State total number of deaths per year for the cause: 4,517
- State percentage of total deaths for the cause: 2.91%
#34 – North Carolina
- Most over-indexed cause of death: Nephritis, nephrotic syndrome and nephrosis
- State age-adjusted death rate for the cause: 20.3 deaths per 100,000 people
- State total number of deaths per year for the cause: 2,040
- State percentage of total deaths for the cause: 2.19%
RELATED
Final expense insurance is used to cover the expenses incurred
when someone passes away. These expenses usually include the funeral
service, burial, or other related items. This can be included in whole
life insurance cost, which is a kind of permanent protection that lasts
until you die.
#35 – North Dakota
- Most over-indexed cause of death: Pneumonitis due to solids and liquids
- State age-adjusted death rate for the cause: 10.4 deaths per 100,000 people
- State total number of deaths per year for the cause: 86
- State percentage of total deaths for the cause: 1.34%
#36 – Ohio
- Most over-indexed cause of death: Accidents (unintentional injuries)
- State age-adjusted death rate for the cause: 76.5 deaths per 100,000 people
- State total number of deaths per year for the cause: 8,971
- State percentage of total deaths for the cause: 7.26%
#37 – Oklahoma
- Most over-indexed cause of death: Chronic lower respiratory diseases
- State age-adjusted death rate for the cause: 79.4 deaths per 100,000 people
- State total number of deaths per year for the cause: 3,035
- State percentage of total deaths for the cause: 7.50%
#38 – Oregon
- Most over-indexed cause of death: Intentional self-harm (suicide)
- State age-adjusted death rate for the cause: 19.6 deaths per 100,000 people
- State total number of deaths per year for the cause: 825
- State percentage of total deaths for the cause: 2.25%
#39 – Pennsylvania
- Most over-indexed cause of death: Accidents (unintentional injuries)
- State age-adjusted death rate for the cause: 71.6 deaths per 100,000 people
- State total number of deaths per year for the cause: 9,527
- State percentage of total deaths for the cause: 7.02%
#40 – Rhode Island
- Most over-indexed cause of death: Accidents (unintentional injuries)
- State age-adjusted death rate for the cause: 63.3 deaths per 100,000 people
- State total number of deaths per year for the cause: 718
- State percentage of total deaths for the cause: 7.07%
#41 – South Carolina
- Most over-indexed cause of death: Septicemia
- State age-adjusted death rate for the cause: 17.2 deaths per 100,000 people
- State total number of deaths per year for the cause: 884
- State percentage of total deaths for the cause: 1.79%
#42 – South Dakota
- Most over-indexed cause of death: Intentional self-harm (suicide)
- State age-adjusted death rate for the cause: 22.6 deaths per 100,000 people
- State total number of deaths per year for the cause: 191
- State percentage of total deaths for the cause: 2.39%
#43 – Tennessee
- Most over-indexed cause of death: Influenza and pneumonia
- State age-adjusted death rate for the cause: 25.2 deaths per 100,000 people
- State total number of deaths per year for the cause: 1,656
- State percentage of total deaths for the cause: 2.36%
#44 – Texas
- Most over-indexed cause of death: Septicemia
- State age-adjusted death rate for the cause: 18.8 deaths per 100,000 people
- State total number of deaths per year for the cause: 4,268
- State percentage of total deaths for the cause: 2.15%
#45 – Utah
- Most over-indexed cause of death: Intentional self-harm (suicide)
- State age-adjusted death rate for the cause: 23 deaths per 100,000 people
- State total number of deaths per year for the cause: 663
- State percentage of total deaths for the cause: 3.68%
#46 – Vermont
- Most over-indexed cause of death: Intentional self-harm (suicide)
- State age-adjusted death rate for the cause: 18 deaths per 100,000 people
- State total number of deaths per year for the cause: 112
- State percentage of total deaths for the cause: 1.86%
#47 – Virginia
- Most over-indexed cause of death: Nephritis, nephrotic syndrome and nephrosis
- State age-adjusted death rate for the cause: 20.2 deaths per 100,000 people
- State total number of deaths per year for the cause: 1,618
- State percentage of total deaths for the cause: 2.36%
#48 – Washington
- Most over-indexed cause of death: Pneumonitis due to solids and liquids
- State age-adjusted death rate for the cause: 8.4 deaths per 100,000 people
- State total number of deaths per year for the cause: 574
- State percentage of total deaths for the cause: 1.01%
#49 – West Virginia
- Most over-indexed cause of death: Accidents (unintentional injuries)
- State age-adjusted death rate for the cause: 102 deaths per 100,000 people
- State total number of deaths per year for the cause: 1,892
- State percentage of total deaths for the cause: 8.13%
#50 – Wisconsin
- Most over-indexed cause of death: Accidents (unintentional injuries)
- State age-adjusted death rate for the cause: 62.7 deaths per 100,000 people
- State total number of deaths per year for the cause: 3,746
- State percentage of total deaths for the cause: 7.11%
#51 – Wyoming
- Most over-indexed cause of death: Intentional self-harm (suicide)
- State age-adjusted death rate for the cause: 27.6 deaths per 100,000 people
- State total number of deaths per year for the cause: 157
- State percentage of total deaths for the cause: 3.29%
Compare Quotes From Top Companies and Save
Complete Study Results of Common Causes of Death per State
Take a look at the table below to see the complete results for every state.
*The death rate is age-adjusted and for every 100,000 state residents.
Frequently Asked Questions: Life Expectancy & Leading Causes of Death
Now that we’ve covered the most common cause of death in all 50 U.S. states, let’s get to your frequently asked questions. They include:
- What was the leading cause of death in the US in 2018?
- What are the two major causes of death in the United States?
- What is the best age to die at?
Let’s jump right in.
#1 – What was the leading cause of death in the US in 2018?
According to the Centers for Disease Control and Prevention, the leading cause of death in the United States for 2018 was heart disease, followed by cancer and unintentional injuries (like accidents). The ranking remained the same from 2017.
#2 – What is the most common cause of unnatural death?
Unintentional injuries, often in the top three categories of leading causes of death overall, are the most common cause of unnatural death, as they have no natural cause and are simply accidents that cause fatalities. Accidents tend to be one of the most common causes of death for young adults. Along those lines, suicides and homicides are two other causes of unnatural death.
#3 – What are the two major causes of death in the United States?
Heart disease and cancer are the two largest causes of death in the United States, with heart disease killing roughly 635,000 people in 2017 and cancer killing 598,000 in that same year.
#4 – What kills the most humans every year?
One of the “animals” that kills the most humans every year might be surprising to you: mosquitos. This is because mosquitos transfer and spread fatal diseases throughout communities, leading to a significant number of deaths every year. One of these diseases is malaria.
#5 – What is the number one killer in the world?
The number one killer in the world — and one that is considered “preventable death” — is heart disease. This issue has grown as populations around the world have become more obese, resulting in a number of diseases related to obesity that are in the top 10 of “killers” such as diabetes.
#6 – What is the best age to die at?
Many people believe that 75 is the perfect age to die as it is the tipping point in when a person can still contribute to society without becoming a burden. People who believe this are often those who have negative views of elderly and older-age life.
#7 – Can someone die for no reason?
The most common causes of death by age group vary. While it is very rare, a person under the age of 35 can die of a condition that generally people much older die for, such as heart disease. Some organizations put this number at 1 out of 100,000, meaning that one person under the age of 35 can die of one of these conditions out of a hundred thousand.
#8 – What’s the most common age of death?
The average life expectancy of an individual varies according to where they live. In some countries, men and women living into their mid-80s or even longer is not unexpected. However, in the United States, both men and women have a life expectancy of below 80.
Methodology: Determining the Common Causes of Death by State
The underlying cause of death data is from the U.S. Centers for Disease Control and Prevention WONDER Online Database. The age-adjusted death rates shown are for 2017, using the 2017 population as the age-adjustment baseline. For the purpose of this analysis, only the top 15 leading causes of death nationally were considered.
For each state, the most over-indexed cause of death was determined by comparing the state level age-adjusted death rate for each cause to its respective national level age-adjusted rate.
The cause of death that had the largest percent difference from the national rate was reported as the most over-indexed cause of death—representing a disproportionately high death rate within the state relative to the national rate.
Median household income statistics are from the U.S. Census Bureau Current Population Survey, Annual Social and Economic Supplements.
Now that you know about the most common cause of death in your state, are you ready to get a life insurance quote? While you may feel like that situation can never happen to you, it always helps to be prepared.
To get the best life insurance quote, just plug your ZIP code into our FREE online quote comparison tool. It’ll give you the best rates based on your demographics and area.
Compare Quotes From Top Companies and Save
Editorial Guidelines: We are a free online resource for anyone interested in learning more about life insurance. Our goal is to be an objective, third-party resource for everything life insurance related. We update our site regularly, and all content is reviewed by life insurance experts.

No comments:
Post a Comment