Tuesday, May 2, 2017

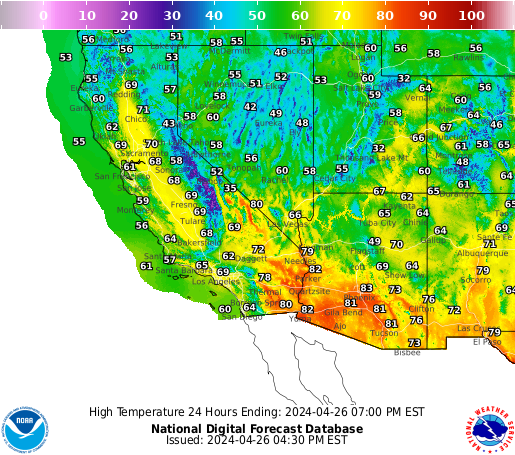
This temperature map for the far west of the U.S. is for May 3rd so you understand what might cause flooding from snow melt


begin quote from:

Eastern Sierra Weather Zonal Forcast - National Weather Service

 
This is a far western temperature map for U.S. on May 3rd 2017. You can see the problem of snow melting this day causing flooding. The little green line from Reno down to Fresno is where all the snow will melt from and likely flood many places like the Merced River in Yosemite Valley in Yosemite National Park.


Graphical Forecasts - Pacific Southwest

Daily View Weekly View Loops
Public Weather Element Page Selected
No Sector Northwest of Pacific Southwest Sector
Pacific Northwest Sector
Central Rockies Sector
Hawaii
Southern Rockies Sector
Hawaii
No Sector South of Pacific Southwest Sector
Southern Plains Sector
Key
Page Help
Print
  
  
Image List | Page Help | Metric Units | Key
Region Menu Region Menu  Go to Region                
View Images   Get Text Forecast
         
Mouse over the table below to change the forecast image.
Choose a Day to ViewDay of Week Image Go back in time 12 hours Go forward in time 12 hours
Max/Min Temperature Low/High Temp selection Image
Probability of Precip. Probability of Precip.Selection Image
Weather Weather time select Weather time select Weather time select Weather time select
Hazards Hazards time select Hazards time select Hazards time select Hazards time select
Temperature Temperature time select Temperature time select Temperature time select Temperature time select
Dewpoint Dewpoint time select Dewpoint time select Dewpoint time select Dewpoint time select
Wind Speed & Direction Wind Speed & Direction time select Wind Speed & Direction time select Wind Speed & Direction time select Wind Speed & Direction time select
Wind Gust Wind Gust time select Wind Gust time select Wind Gust time select Wind Gust time select
Sky Cover Sky Cover time select Sky Cover time select Sky Cover time select Sky Cover time select
Amount of Precip. Amount of Precip. Selection Image Amount of Precip. Selection Image
Snow Amount Snow Amount Selection Image Snow Amount Selection Image
Ice Accumulation Ice Accumulation Selection Image Ice Accumulation Selection Image
Wave Height Wave Height Selection Image Wave Height Selection Image
Apparent Temperature Apparent Temperature time select Apparent Temperature time select Apparent Temperature time select Apparent Temperature time select
Relative Humidity Relative Humidity time select Relative Humidity time select Relative Humidity time select Relative Humidity time select
Next Image Step backward one image Step forward one image
Element Table Help
Overview of Region

conus Overview Image

No comments: